- Home >
- Stock Photos >
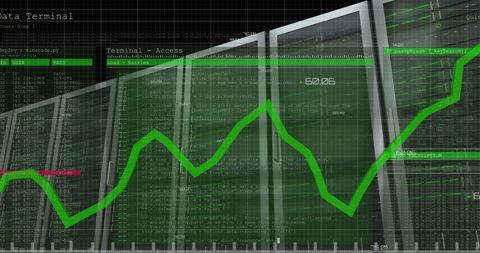
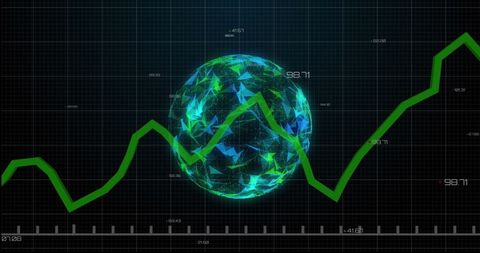
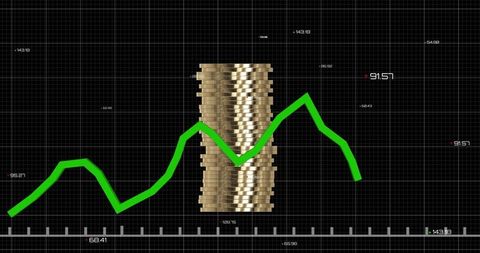
- Digital Data Visualization with Global Analytics Interface
Digital Data Visualization with Global Analytics Interface Image
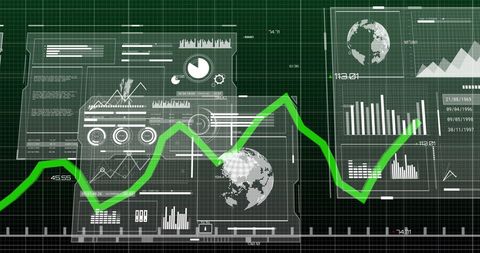
Futuristic digital interface illustrating complex graphs and charts displaying global trends. Ideal for use in presentations on financial analytics, technological advancements in data analysis, and business reviews. Useful for creating infographics focused on data strategy, statistical intelligence, and global economic insights.

downloads
Tags:
More
Credit Photo
If you would like to credit the Photo, here are some ways you can do so
Text Link
photo Link
<span class="text-link">
<span>
<a target="_blank" href=https://pikwizard.com/photo/digital-data-visualization-with-global-analytics-interface/bc50ef0f76841c41df235b2426ad0be8/>PikWizard</a>
</span>
</span>
<span class="image-link">
<span
style="margin: 0 0 20px 0; display: inline-block; vertical-align: middle; width: 100%;"
>
<a
target="_blank"
href="https://pikwizard.com/photo/digital-data-visualization-with-global-analytics-interface/bc50ef0f76841c41df235b2426ad0be8/"
style="text-decoration: none; font-size: 10px; margin: 0;"
>
<img src="https://pikwizard.com/pw/medium/bc50ef0f76841c41df235b2426ad0be8.jpg" style="margin: 0; width: 100%;" alt="" />
<p style="font-size: 12px; margin: 0;">PikWizard</p>
</a>
</span>
</span>
Free (free of charge)
Free for personal and commercial use.
Author: Awesome Content