
- Home >
- Stock Photos >
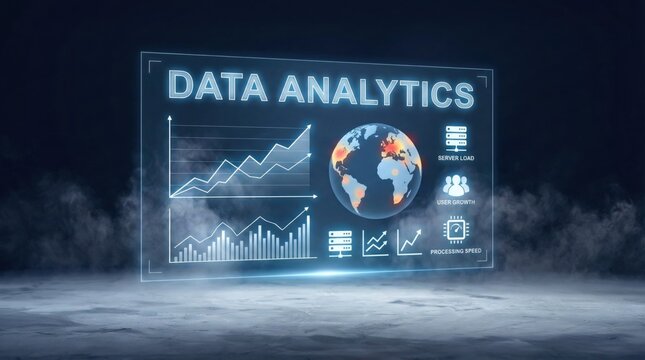
- Digital Data Visualization with Global Financial Trends
Digital Data Visualization with Global Financial Trends Image

This depiction of vibrant data charts against a blue background illustrates the interconnectedness of global finance trends. Useful for presentations or articles on digital economics, data-driven technologies, or investment strategies.
Powered by 


downloads
Tags:
More
Credit Photo
If you would like to credit the Photo, here are some ways you can do so
Text Link
photo Link
<span class="text-link">
<span>
<a target="_blank" href=https://pikwizard.com/photo/digital-data-visualization-with-global-financial-trends/6c0d2935d3a8dacf64a1ed15b800e2c0/>PikWizard</a>
</span>
</span>
<span class="image-link">
<span
style="margin: 0 0 20px 0; display: inline-block; vertical-align: middle; width: 100%;"
>
<a
target="_blank"
href="https://pikwizard.com/photo/digital-data-visualization-with-global-financial-trends/6c0d2935d3a8dacf64a1ed15b800e2c0/"
style="text-decoration: none; font-size: 10px; margin: 0;"
>
<img src="https://pikwizard.com/pw/medium/6c0d2935d3a8dacf64a1ed15b800e2c0.jpg" style="margin: 0; width: 100%;" alt="" />
<p style="font-size: 12px; margin: 0;">PikWizard</p>
</a>
</span>
</span>
Free (free of charge)
Free for personal and commercial use.
Author: Awesome Content
Similar Free Stock Images

Premium


Premium

Premium


Premium


Premium


Premium


Premium

Premium


Premium


Premium

Premium

AI


Premium


AI


Premium


Premium


Premium


Premium


Premium


Premium


Premium


Premium

Premium


Premium


Premium


Premium

Premium

Explore More Free Stock Images