
- Home >
- Stock Photos >
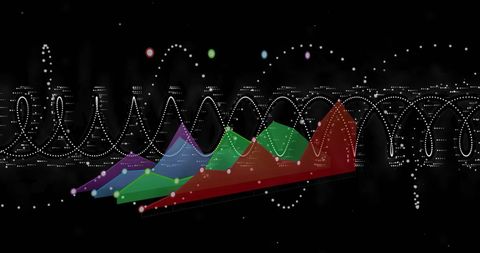
- Digital Data Visualization with Graph and Sound Wave
Digital Data Visualization with Graph and Sound Wave Image
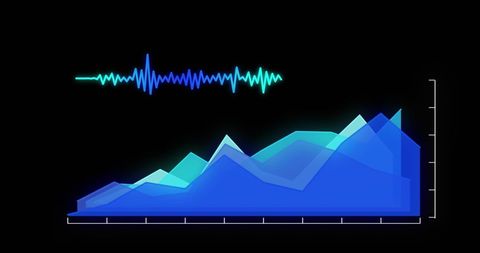
Depicts statistical data processing on digital interface with a combination of line graph and sound wave against black background. Suitable for illustrating data analysis, technological advancements, and multimedia processing presentations. Ideal for use in tech and data-centric web and print marketing materials.
Powered by 


downloads
Tags:
More
Credit Photo
If you would like to credit the Photo, here are some ways you can do so
Text Link
photo Link
<span class="text-link">
<span>
<a target="_blank" href=https://pikwizard.com/photo/digital-data-visualization-with-graph-and-sound-wave/e8125fd45777cc21000aa216ae836f0e/>PikWizard</a>
</span>
</span>
<span class="image-link">
<span
style="margin: 0 0 20px 0; display: inline-block; vertical-align: middle; width: 100%;"
>
<a
target="_blank"
href="https://pikwizard.com/photo/digital-data-visualization-with-graph-and-sound-wave/e8125fd45777cc21000aa216ae836f0e/"
style="text-decoration: none; font-size: 10px; margin: 0;"
>
<img src="https://pikwizard.com/pw/medium/e8125fd45777cc21000aa216ae836f0e.jpg" style="margin: 0; width: 100%;" alt="" />
<p style="font-size: 12px; margin: 0;">PikWizard</p>
</a>
</span>
</span>
Free (free of charge)
Free for personal and commercial use.
Author: People Creations
Similar Free Stock Images

Premium


Premium


Premium


Premium


Premium


Premium

Premium

Premium

Premium


Premium


Premium


Premium

Premium


Premium


Premium


Premium


Premium


Premium


Premium


Premium


Premium


Premium


Premium


Premium


Premium

Explore More Free Stock Images