
- Home >
- Stock Photos >
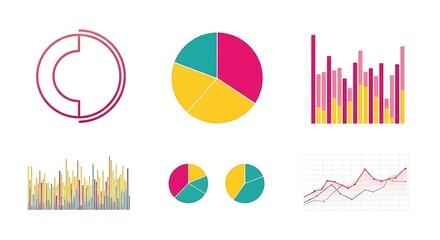
- Digital Data Visualization with Graphs and Charts on Blue Background
Digital Data Visualization with Graphs and Charts on Blue Background Image

Image depicts digital data visualization featuring graphs, charts, and numerical data transitioning over a blue background. It signifies concepts such as business analysis, growth, report generation, and technological progress. Ideal for use in presentations, business reports, articles on data science, and websites focusing on technology and analysis.
Powered by 


downloads
Tags:
More
Credit Photo
If you would like to credit the Photo, here are some ways you can do so
Text Link
photo Link
<span class="text-link">
<span>
<a target="_blank" href=https://pikwizard.com/photo/digital-data-visualization-with-graphs-and-charts-on-blue-background/fa63e404a31f04e683db8caac082ce64/>PikWizard</a>
</span>
</span>
<span class="image-link">
<span
style="margin: 0 0 20px 0; display: inline-block; vertical-align: middle; width: 100%;"
>
<a
target="_blank"
href="https://pikwizard.com/photo/digital-data-visualization-with-graphs-and-charts-on-blue-background/fa63e404a31f04e683db8caac082ce64/"
style="text-decoration: none; font-size: 10px; margin: 0;"
>
<img src="https://pikwizard.com/pw/medium/fa63e404a31f04e683db8caac082ce64.jpg" style="margin: 0; width: 100%;" alt="" />
<p style="font-size: 12px; margin: 0;">PikWizard</p>
</a>
</span>
</span>
Free (free of charge)
Free for personal and commercial use.
Author: People Creations
Similar Free Stock Images

Premium


Premium

Premium


Premium


Premium


Premium


Premium


Premium


Premium


Premium


Premium


Premium


Premium


Premium

Premium

Premium


Premium


Premium


Premium


Premium


Premium


Premium


Premium


Premium


Premium


Explore More Free Stock Images