- Home >
- Stock Photos >
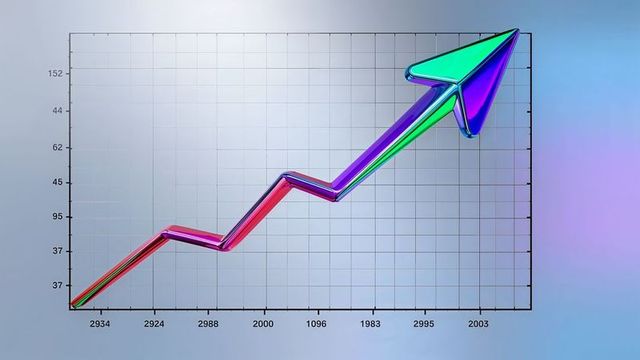
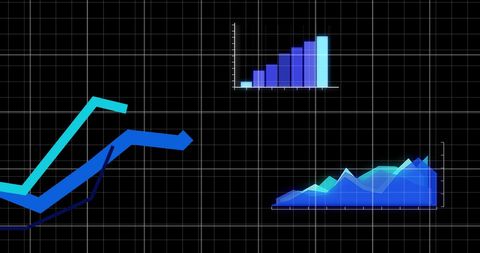
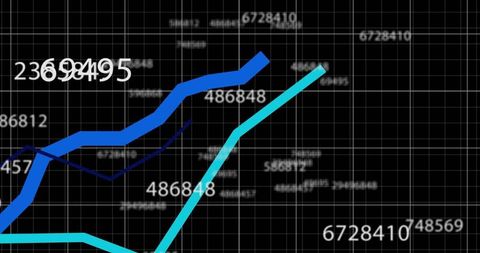
- Digital Data Visualization with Graphs and Charts on Dark Grid Background
Digital Data Visualization with Graphs and Charts on Dark Grid Background Image
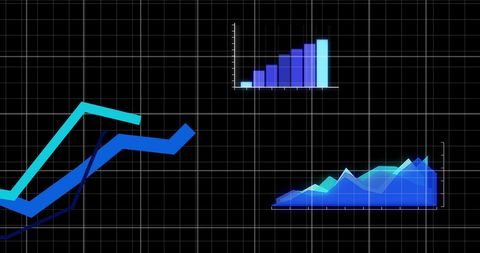
Visual features several data graphs including bar and line charts on dark grid background. Excellent for illustrating data analysis, financial reporting, and digital business innovations. Suitable for use in presentations, articles, and websites involving technology and data science topics.

downloads
Tags:
More
Credit Photo
If you would like to credit the Photo, here are some ways you can do so
Text Link
photo Link
<span class="text-link">
<span>
<a target="_blank" href=https://pikwizard.com/photo/digital-data-visualization-with-graphs-and-charts-on-dark-grid-background/8227e11f5d6e92ba47fc89834db7564e/>PikWizard</a>
</span>
</span>
<span class="image-link">
<span
style="margin: 0 0 20px 0; display: inline-block; vertical-align: middle; width: 100%;"
>
<a
target="_blank"
href="https://pikwizard.com/photo/digital-data-visualization-with-graphs-and-charts-on-dark-grid-background/8227e11f5d6e92ba47fc89834db7564e/"
style="text-decoration: none; font-size: 10px; margin: 0;"
>
<img src="https://pikwizard.com/pw/medium/8227e11f5d6e92ba47fc89834db7564e.jpg" style="margin: 0; width: 100%;" alt="" />
<p style="font-size: 12px; margin: 0;">PikWizard</p>
</a>
</span>
</span>
Free (free of charge)
Free for personal and commercial use.
Author: People Creations