- Home >
- Stock Photos >
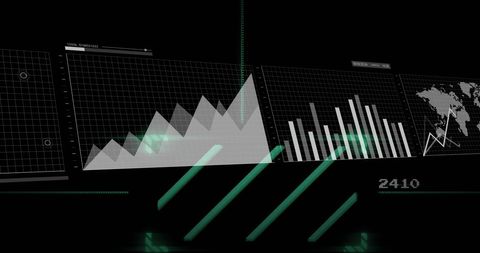
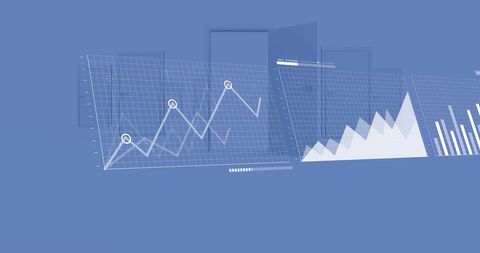
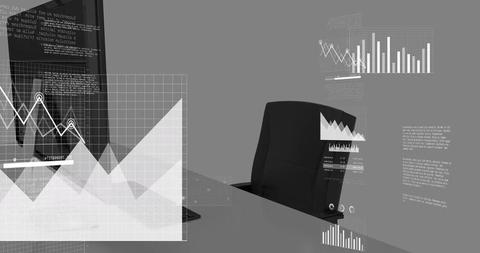
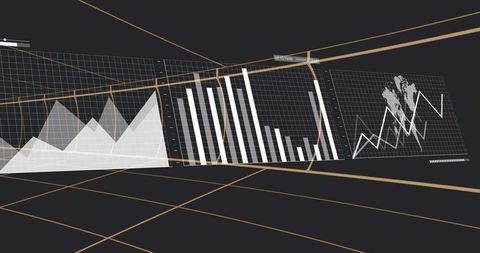
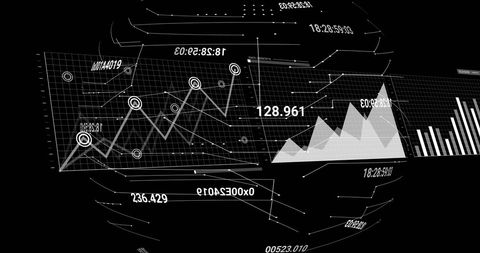
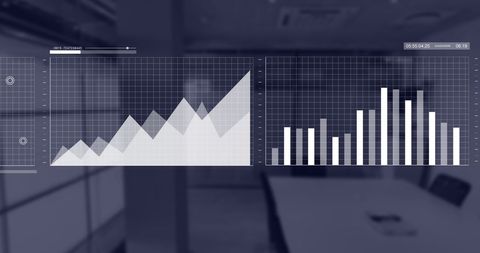
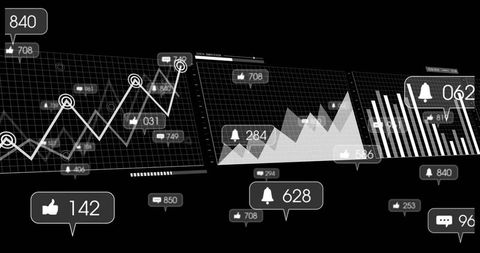
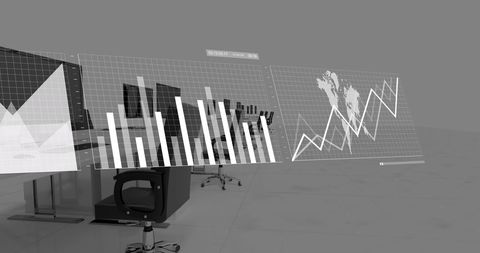
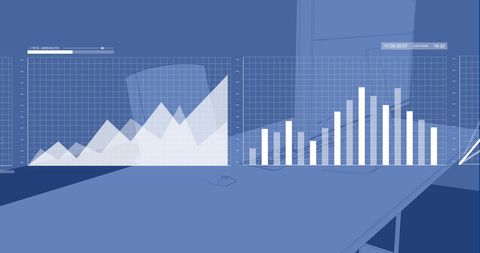
- Digital Data Visualization with Graphs in Business Office
Digital Data Visualization with Graphs in Business Office Image

Digital graphs overlay a blurred business office background, performing detailed financial data analysis. Representing concepts of digital analytics and technology-driven business insights, this scene serves as an excellent visual for showcasing professional presentations, financial reports, and corporate planning materials.

downloads
Tags:
More
Credit Photo
If you would like to credit the Photo, here are some ways you can do so
Text Link
photo Link
<span class="text-link">
<span>
<a target="_blank" href=https://pikwizard.com/photo/digital-data-visualization-with-graphs-in-business-office/c345dbd02643b5a5fd9279149c8d6dfa/>PikWizard</a>
</span>
</span>
<span class="image-link">
<span
style="margin: 0 0 20px 0; display: inline-block; vertical-align: middle; width: 100%;"
>
<a
target="_blank"
href="https://pikwizard.com/photo/digital-data-visualization-with-graphs-in-business-office/c345dbd02643b5a5fd9279149c8d6dfa/"
style="text-decoration: none; font-size: 10px; margin: 0;"
>
<img src="https://pikwizard.com/pw/medium/c345dbd02643b5a5fd9279149c8d6dfa.jpg" style="margin: 0; width: 100%;" alt="" />
<p style="font-size: 12px; margin: 0;">PikWizard</p>
</a>
</span>
</span>
Free (free of charge)
Free for personal and commercial use.
Author: Authentic Images