
- Home >
- Stock Photos >
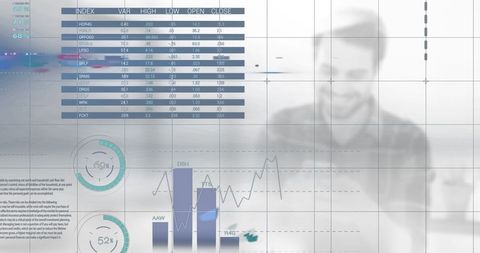
- Digital Data Visualization with Interactive Analytics and World Map
Digital Data Visualization with Interactive Analytics and World Map Image

Futuristic digital screen showcasing interactive data visualization with immersive graphs, charts, and a world map overlay. Useful for topics in technology, data sciences, business intelligence, and global analytics projects. Ideal for presentations, reports, and technology-related content illustrating complex data in a simplified, graphic-rich manner.
Powered by  - Get 15% off with code: PIKWIZARD15


downloads
Tags:
More
Credit Photo
If you would like to credit the Photo, here are some ways you can do so
Text Link
photo Link
<span class="text-link">
<span>
<a target="_blank" href=https://pikwizard.com/photo/digital-data-visualization-with-interactive-analytics-and-world-map/97527c8e089048aacd1a1750eb7d90fa/>PikWizard</a>
</span>
</span>
<span class="image-link">
<span
style="margin: 0 0 20px 0; display: inline-block; vertical-align: middle; width: 100%;"
>
<a
target="_blank"
href="https://pikwizard.com/photo/digital-data-visualization-with-interactive-analytics-and-world-map/97527c8e089048aacd1a1750eb7d90fa/"
style="text-decoration: none; font-size: 10px; margin: 0;"
>
<img src="https://pikwizard.com/pw/medium/97527c8e089048aacd1a1750eb7d90fa.jpg" style="margin: 0; width: 100%;" alt="" />
<p style="font-size: 12px; margin: 0;">PikWizard</p>
</a>
</span>
</span>
Free (free of charge)
Free for personal and commercial use.
Author: Authentic Images
Similar Free Stock Images

Premium


Premium


Premium


Premium


Premium


Premium

Premium

Premium


Premium


Premium

Premium


Premium


Premium


Premium


Premium


Premium


Premium


Premium


Premium

Premium


Premium


Premium


Premium


Premium


Premium


Explore More Free Stock Images