- Home >
- Stock Photos >
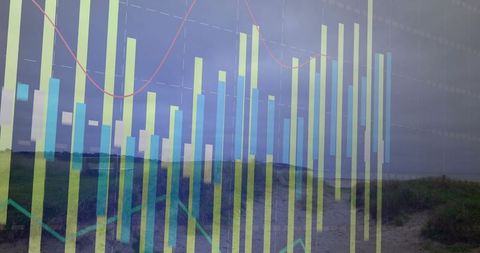
- Digital Data Visualization with Line and Bar Chart in Blue
Digital Data Visualization with Line and Bar Chart in Blue Image

This visual effectively represents a digital data analytics interface featuring vertical bar charts alongside line graphs in vibrant hues of blue, cyan, and red. The arteries of a technologically-driven grid present important projections and statistical insights beneficial to finance professionals. Useful for illustrating concepts of market trends, financial analysis, and technology enhancements in reports, presentations, and articles aimed at corporate and academic audiences seeking comprehensive online interfaces.

downloads
Tags:
More
Credit Photo
If you would like to credit the Photo, here are some ways you can do so
Text Link
photo Link
<span class="text-link">
<span>
<a target="_blank" href=https://pikwizard.com/photo/digital-data-visualization-with-line-and-bar-chart-in-blue/5f24b995df2f995ef0e79a066775a774/>PikWizard</a>
</span>
</span>
<span class="image-link">
<span
style="margin: 0 0 20px 0; display: inline-block; vertical-align: middle; width: 100%;"
>
<a
target="_blank"
href="https://pikwizard.com/photo/digital-data-visualization-with-line-and-bar-chart-in-blue/5f24b995df2f995ef0e79a066775a774/"
style="text-decoration: none; font-size: 10px; margin: 0;"
>
<img src="https://pikwizard.com/pw/medium/5f24b995df2f995ef0e79a066775a774.jpg" style="margin: 0; width: 100%;" alt="" />
<p style="font-size: 12px; margin: 0;">PikWizard</p>
</a>
</span>
</span>
Free (free of charge)
Free for personal and commercial use.
Author: People Creations