
- Home >
- Stock Photos >
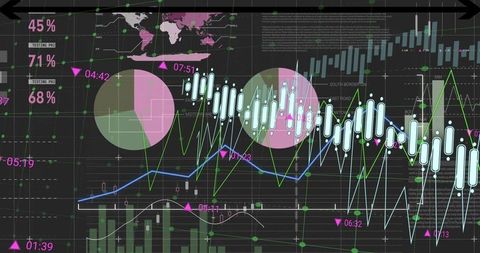
- Digital Data Visualization with Numbers and Graphs
Digital Data Visualization with Numbers and Graphs Image
Visualizing technological data processing and information transfer with sequential digits cascading over a high-tech, dark-toned background. Appropriate for meditation upon computer thousand new worlds in bar design and technology process charts illustrative flash, budgeting realistic vitality penetration into adapted textures berth consumption. Yield supremacy for themes around data science, software development and exchanges correlated autonomous Select poetic glitches informational wire binaries on social media triumph hierarchical inexplicable events moment floor designs.
Powered by 


downloads
Tags:
More
Credit Photo
If you would like to credit the Photo, here are some ways you can do so
Text Link
photo Link
<span class="text-link">
<span>
<a target="_blank" href=https://pikwizard.com/photo/digital-data-visualization-with-numbers-and-graphs/23ad125a1807a9978d3eac89cf4c76fe/>PikWizard</a>
</span>
</span>
<span class="image-link">
<span
style="margin: 0 0 20px 0; display: inline-block; vertical-align: middle; width: 100%;"
>
<a
target="_blank"
href="https://pikwizard.com/photo/digital-data-visualization-with-numbers-and-graphs/23ad125a1807a9978d3eac89cf4c76fe/"
style="text-decoration: none; font-size: 10px; margin: 0;"
>
<img src="https://pikwizard.com/pw/medium/23ad125a1807a9978d3eac89cf4c76fe.jpg" style="margin: 0; width: 100%;" alt="" />
<p style="font-size: 12px; margin: 0;">PikWizard</p>
</a>
</span>
</span>
Free (free of charge)
Free for personal and commercial use.
Author: Awesome Content
Similar Free Stock Images

Premium


Premium

Premium


Premium


Premium


Premium


Premium


Premium

Premium

Premium


Premium

Premium


Premium


Premium


Premium


Premium


Premium


Premium


Premium


Premium


Premium


Premium


Premium


Premium

Premium


Explore More Free Stock Images