
- Home >
- Stock Photos >
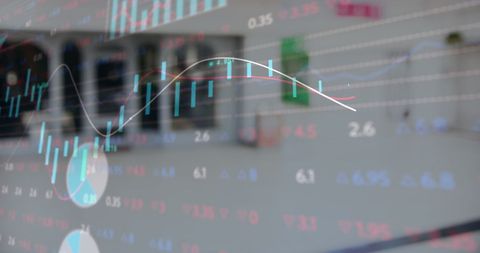
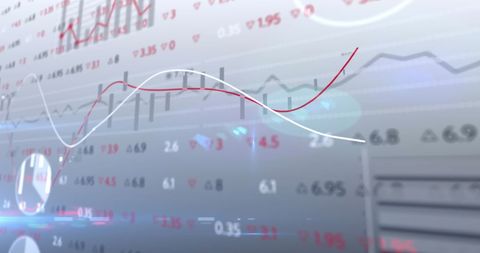
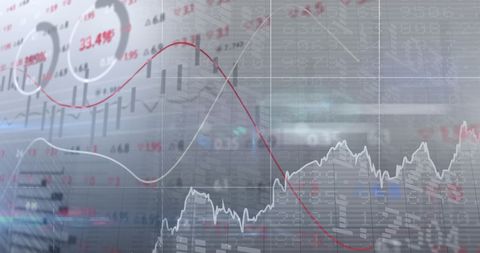
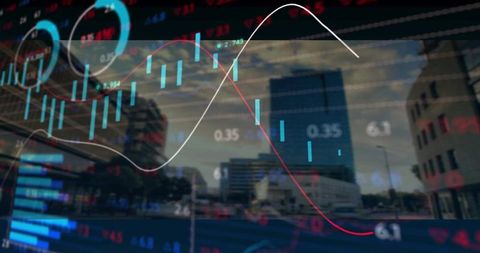
- Digital Data Visualization with Overlay Candlestick and Line Graphs
Digital Data Visualization with Overlay Candlestick and Line Graphs Image

Translucent candlestick and line graphs overlaying a blurred wooden desk backdrop with visible technology gadgets like smartphones and laptops. This dynamic composition captures the essence of modern financial analytics and business intelligence in the digital economy. It is ideal for use in business articles, technology media, financial investment brochures, or economic trend reports, effectively representing themes of evolving financial technology and data-driven decision-making.
Powered by 


downloads
Tags:
More
Credit Photo
If you would like to credit the Photo, here are some ways you can do so
Text Link
photo Link
<span class="text-link">
<span>
<a target="_blank" href=https://pikwizard.com/photo/digital-data-visualization-with-overlay-candlestick-and-line-graphs/6eb285e27949139b3225668dbf2936bd/>PikWizard</a>
</span>
</span>
<span class="image-link">
<span
style="margin: 0 0 20px 0; display: inline-block; vertical-align: middle; width: 100%;"
>
<a
target="_blank"
href="https://pikwizard.com/photo/digital-data-visualization-with-overlay-candlestick-and-line-graphs/6eb285e27949139b3225668dbf2936bd/"
style="text-decoration: none; font-size: 10px; margin: 0;"
>
<img src="https://pikwizard.com/pw/medium/6eb285e27949139b3225668dbf2936bd.jpg" style="margin: 0; width: 100%;" alt="" />
<p style="font-size: 12px; margin: 0;">PikWizard</p>
</a>
</span>
</span>
Free (free of charge)
Free for personal and commercial use.
Author: Awesome Content
Similar Free Stock Images

Premium


Premium
Premium


Premium


Premium


Premium

Premium

Premium

Premium


Premium


Premium


Premium


Premium


Premium


Premium


Premium

Premium


Premium


Premium


Premium


Premium


Premium

Premium


Premium


Premium

Explore More Free Stock Images