
- Home >
- Stock Photos >
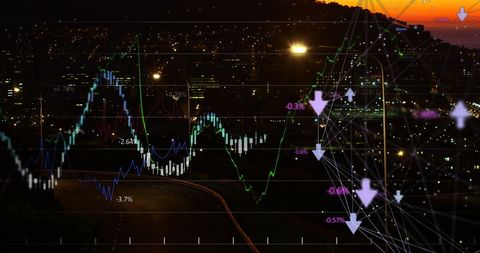
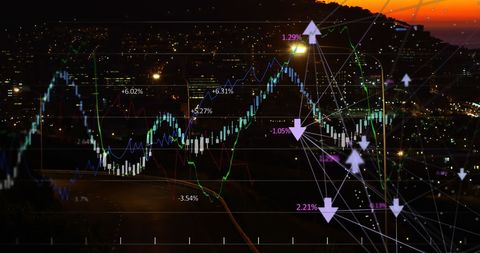
- Digital Data Visualization with Shaped Patterns and Stock Analysis
Digital Data Visualization with Shaped Patterns and Stock Analysis Image

This abstract digital visualization incorporates data analytics concepts such as finance and stock market behavior with trending line graphs and abstract shapes. The swirling pattern and adjustable digital margins suggest movement, connectivity, and complexity—ideal for illustrating articles or presentations focused on trends or technology transformations in business models.
Powered by 


downloads
Tags:
More
Credit Photo
If you would like to credit the Photo, here are some ways you can do so
Text Link
photo Link
<span class="text-link">
<span>
<a target="_blank" href=https://pikwizard.com/photo/digital-data-visualization-with-shaped-patterns-and-stock-analysis/2fb1593c24e0c69f88ff0a5823cb5bd4/>PikWizard</a>
</span>
</span>
<span class="image-link">
<span
style="margin: 0 0 20px 0; display: inline-block; vertical-align: middle; width: 100%;"
>
<a
target="_blank"
href="https://pikwizard.com/photo/digital-data-visualization-with-shaped-patterns-and-stock-analysis/2fb1593c24e0c69f88ff0a5823cb5bd4/"
style="text-decoration: none; font-size: 10px; margin: 0;"
>
<img src="https://pikwizard.com/pw/medium/2fb1593c24e0c69f88ff0a5823cb5bd4.jpg" style="margin: 0; width: 100%;" alt="" />
<p style="font-size: 12px; margin: 0;">PikWizard</p>
</a>
</span>
</span>
Free (free of charge)
Free for personal and commercial use.
Author: Authentic Images
Similar Free Stock Images

Premium


Premium


Premium


Premium


Premium


Premium


Premium


Premium

Premium


Premium


Premium


Premium


Premium


Premium


Premium


Premium


Premium


Premium
Premium


Premium


Premium


Premium


Premium


Premium

Premium


Explore More Free Stock Images