
- Home >
- Stock Photos >
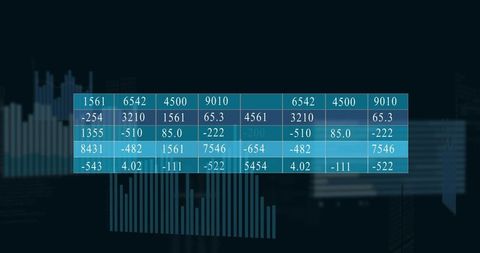
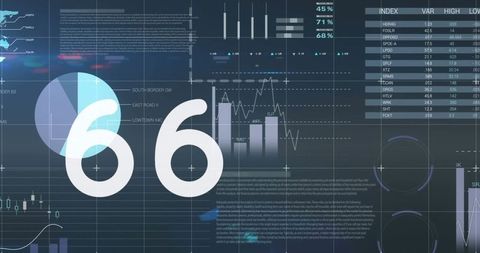
- Digital Data Visualization with Statistics and Global Maps
Digital Data Visualization with Statistics and Global Maps Image

Visual shows a digital representation of data with various numbers and statistical charts overlayed on a dark background. Includes global maps and data points, conveying a sense of global connections and analytics. Useful for illustrating concepts in data analysis, financial trends, global communication technology, and computing.
Powered by 


downloads
Tags:
More
Credit Photo
If you would like to credit the Photo, here are some ways you can do so
Text Link
photo Link
<span class="text-link">
<span>
<a target="_blank" href=https://pikwizard.com/photo/digital-data-visualization-with-statistics-and-global-maps/1dc3e81f5cbb18bfaf74d4dc5150424d/>PikWizard</a>
</span>
</span>
<span class="image-link">
<span
style="margin: 0 0 20px 0; display: inline-block; vertical-align: middle; width: 100%;"
>
<a
target="_blank"
href="https://pikwizard.com/photo/digital-data-visualization-with-statistics-and-global-maps/1dc3e81f5cbb18bfaf74d4dc5150424d/"
style="text-decoration: none; font-size: 10px; margin: 0;"
>
<img src="https://pikwizard.com/pw/medium/1dc3e81f5cbb18bfaf74d4dc5150424d.jpg" style="margin: 0; width: 100%;" alt="" />
<p style="font-size: 12px; margin: 0;">PikWizard</p>
</a>
</span>
</span>
Free (free of charge)
Free for personal and commercial use.
Author: Awesome Content
Similar Free Stock Images

Premium


Premium


Premium


Premium


Premium


Premium


Premium


Premium


Premium


Premium


Premium


Premium

Premium

Premium


Premium


Premium

Premium


Premium


Premium


Premium


Premium


Premium


Premium


Premium


Premium

Explore More Free Stock Images