
- Home >
- Stock Photos >
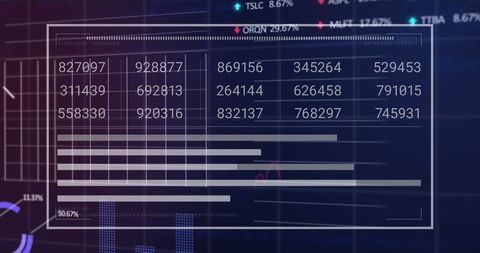
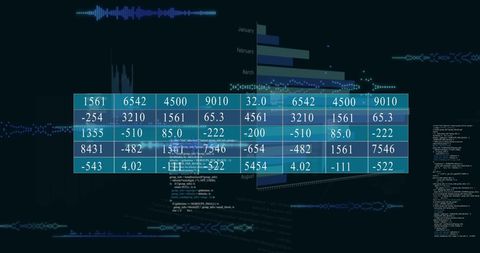
- Digital Data Visualization with Tech-Inspired Bar Graph and Numbers
Digital Data Visualization with Tech-Inspired Bar Graph and Numbers Image
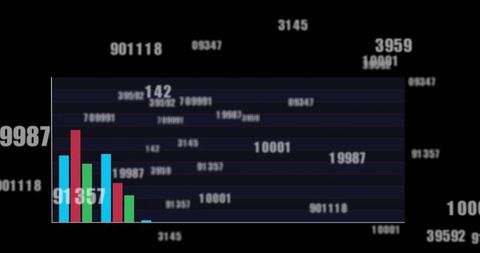
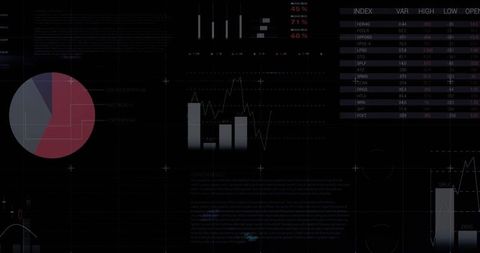
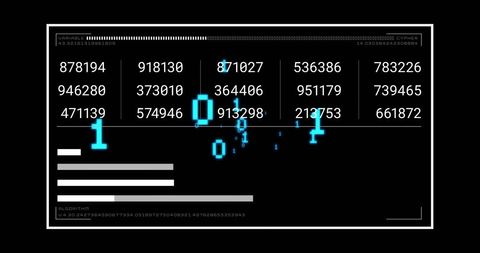
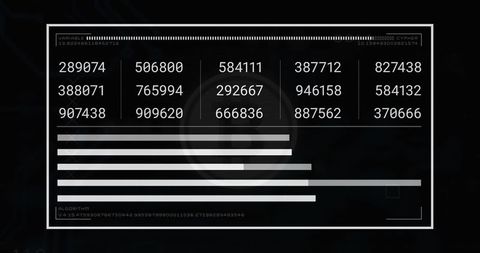
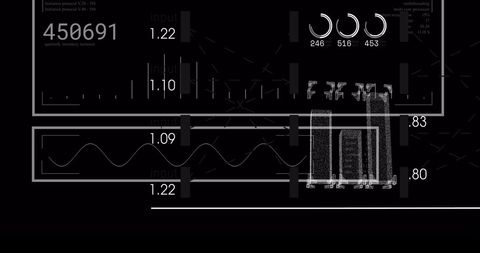
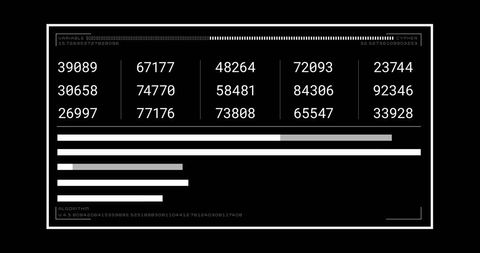
Digital-themed visual showcasing a bar graph against a dark blue grid backdrop, with scattered white numerical values. Features cyan, red, and green vertical bars, conveying tech and modern analytics essence. Ideal for use in presentations about data analysis, modern technology solutions, as well as educational material on digital dashboards and statistics.
Powered by 


downloads
Tags:
More
Credit Photo
If you would like to credit the Photo, here are some ways you can do so
Text Link
photo Link
<span class="text-link">
<span>
<a target="_blank" href=https://pikwizard.com/photo/digital-data-visualization-with-tech-inspired-bar-graph-and-numbers/762f3be97530c915939bf50c97a25b8a/>PikWizard</a>
</span>
</span>
<span class="image-link">
<span
style="margin: 0 0 20px 0; display: inline-block; vertical-align: middle; width: 100%;"
>
<a
target="_blank"
href="https://pikwizard.com/photo/digital-data-visualization-with-tech-inspired-bar-graph-and-numbers/762f3be97530c915939bf50c97a25b8a/"
style="text-decoration: none; font-size: 10px; margin: 0;"
>
<img src="https://pikwizard.com/pw/medium/762f3be97530c915939bf50c97a25b8a.jpg" style="margin: 0; width: 100%;" alt="" />
<p style="font-size: 12px; margin: 0;">PikWizard</p>
</a>
</span>
</span>
Free (free of charge)
Free for personal and commercial use.
Author: Creative Art
Similar Free Stock Images

Premium


Premium


Premium


Premium


Premium


Premium


Premium


Premium

Premium


Premium


Premium


Premium


Premium


Premium

Premium


Premium


Premium

Premium


Premium


Premium


Premium


Premium


Premium


Premium

Premium


Explore More Free Stock Images