
- Home >
- Stock Photos >
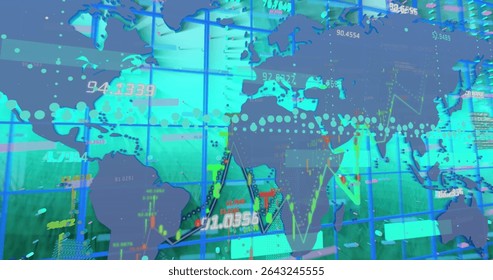
- Digital Data Visualization with World Map and Graphs
Digital Data Visualization with World Map and Graphs Image

This visual showcases advanced digital data processing with graphical charts overlaying a pixelated world map. Perfect for illustrating global business strategies, technological advancements, or financial market trends. Can be used in tech presentations, business reports, or educational materials discussing digital transformation and data analytics.
Powered by  - Get 15% off with code: PIKWIZARD15


downloads
Tags:
More
Credit Photo
If you would like to credit the Photo, here are some ways you can do so
Text Link
photo Link
<span class="text-link">
<span>
<a target="_blank" href=https://pikwizard.com/photo/digital-data-visualization-with-world-map-and-graphs/14de7238fc0317f79fdaa20f24e299d3/>PikWizard</a>
</span>
</span>
<span class="image-link">
<span
style="margin: 0 0 20px 0; display: inline-block; vertical-align: middle; width: 100%;"
>
<a
target="_blank"
href="https://pikwizard.com/photo/digital-data-visualization-with-world-map-and-graphs/14de7238fc0317f79fdaa20f24e299d3/"
style="text-decoration: none; font-size: 10px; margin: 0;"
>
<img src="https://pikwizard.com/pw/medium/14de7238fc0317f79fdaa20f24e299d3.jpg" style="margin: 0; width: 100%;" alt="" />
<p style="font-size: 12px; margin: 0;">PikWizard</p>
</a>
</span>
</span>
Free (free of charge)
Free for personal and commercial use.
Author: Authentic Images
Similar Free Stock Images

Premium


Premium

Premium


Premium


Premium


Premium


Premium


Premium

Premium
Premium

Premium


Premium


Premium


Premium


Premium


Premium


Premium


Premium


Premium


Premium


Premium

Premium


Premium


Premium


Premium


Explore More Free Stock Images