
- Home >
- Stock Photos >
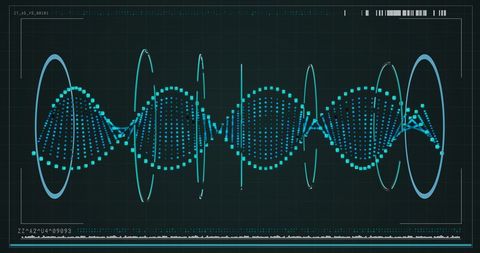
- Digital Data Waveform and Red Arrows on Screen
Digital Data Waveform and Red Arrows on Screen Image

Capturing futuristic interface displaying digital waveform and data integration. Ideal for showcasing data analytics, technology trends, and industrial visualizations. Use in marketing materials for tech firms, finance data analysis, or presentations focusing on advanced data technologies.
Powered by 


downloads
Tags:
More
Credit Photo
If you would like to credit the Photo, here are some ways you can do so
Text Link
photo Link
<span class="text-link">
<span>
<a target="_blank" href=https://pikwizard.com/photo/digital-data-waveform-and-red-arrows-on-screen/17d7fb8b1a56638f3ca940b7cc8ccd86/>PikWizard</a>
</span>
</span>
<span class="image-link">
<span
style="margin: 0 0 20px 0; display: inline-block; vertical-align: middle; width: 100%;"
>
<a
target="_blank"
href="https://pikwizard.com/photo/digital-data-waveform-and-red-arrows-on-screen/17d7fb8b1a56638f3ca940b7cc8ccd86/"
style="text-decoration: none; font-size: 10px; margin: 0;"
>
<img src="https://pikwizard.com/pw/medium/17d7fb8b1a56638f3ca940b7cc8ccd86.jpg" style="margin: 0; width: 100%;" alt="" />
<p style="font-size: 12px; margin: 0;">PikWizard</p>
</a>
</span>
</span>
Free (free of charge)
Free for personal and commercial use.
Author: Creative Art
Similar Free Stock Images

Premium


Premium

Premium


Premium


Premium


Premium


Premium


Premium

Premium

Premium


Premium


Premium


Premium


Premium


Premium


Premium

Premium


Premium


Premium

Premium

Premium


Premium

Premium


Premium


Premium


Explore More Free Stock Images