- Home >
- Stock Photos >
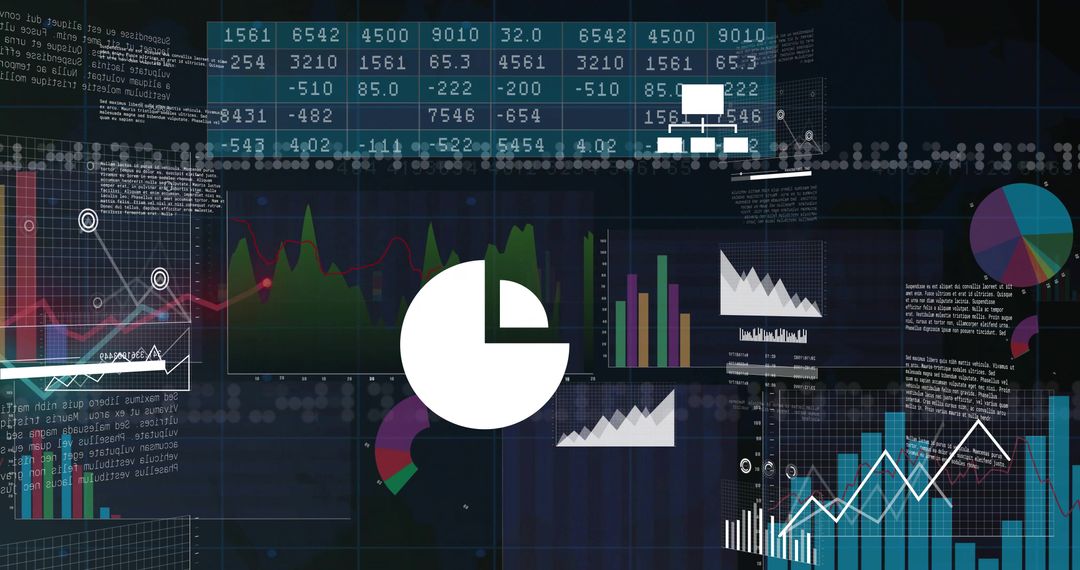
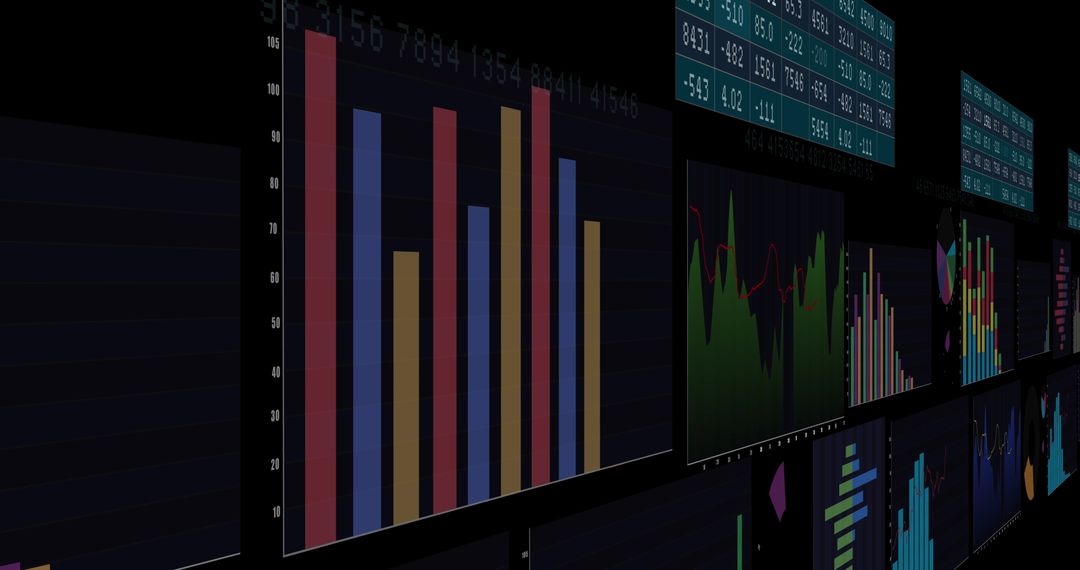
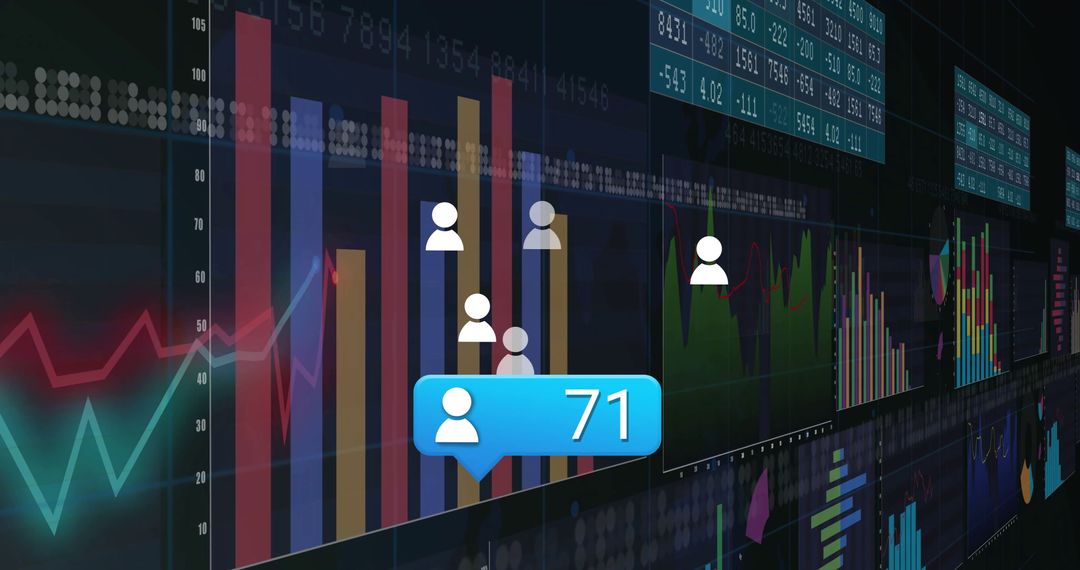
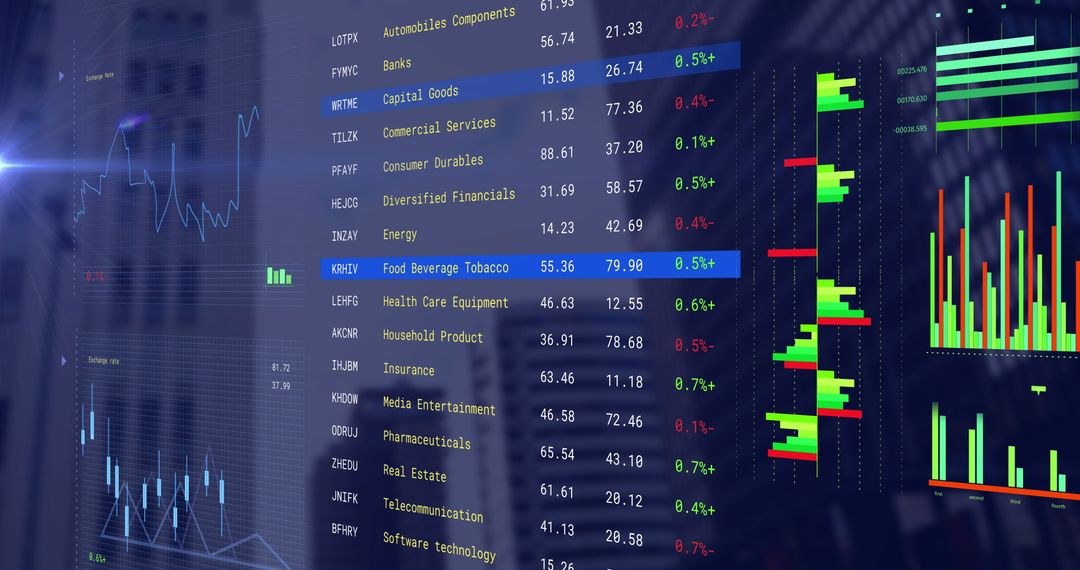
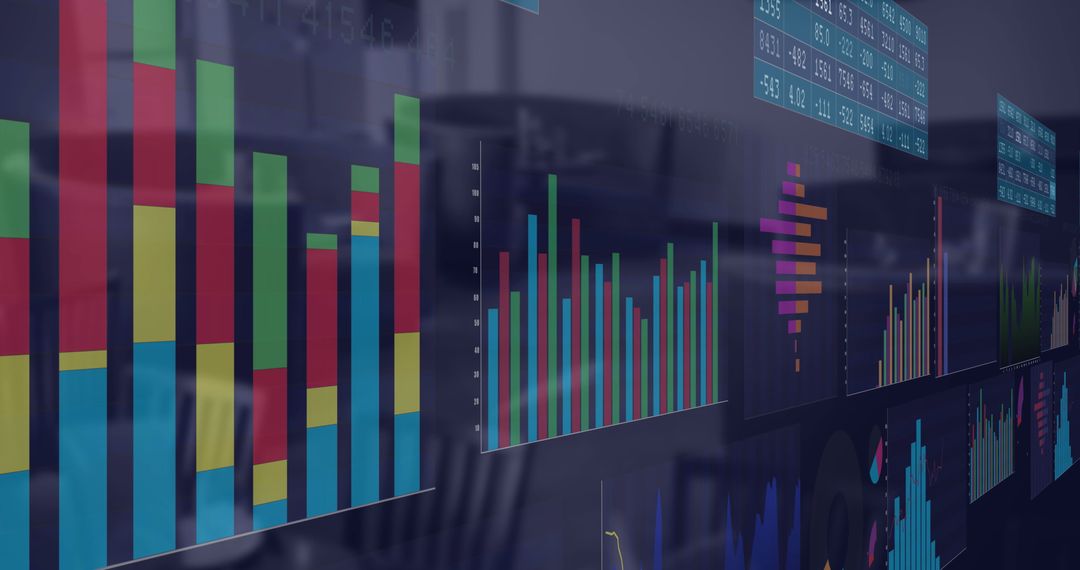
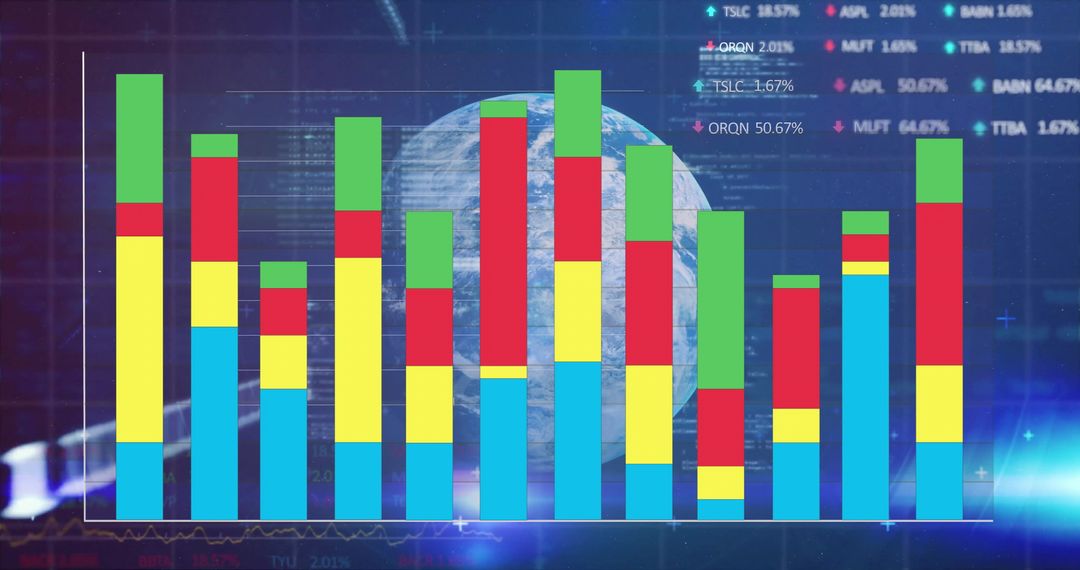
- Digital Display of Financial Charts and Graphs in Dark Mode
Digital Display of Financial Charts and Graphs in Dark Mode Image

Various colorful charts and graphs depicted against a dark background offer an engaging visual portrayal of financial data and analytics. Suitable for use in presentations about economic trends, stock market analysis, digital business strategies, and financial growth. Ideal aid for promoting financial services, educational content on economics, and technology-based professional workshops.
Powered by 


2
downloads
downloads
Tags:
More
Credit Photo
If you would like to credit the Photo, here are some ways you can do so
Text Link
photo Link
<span class="text-link">
<span>
<a target="_blank" href=https://pikwizard.com/photo/digital-display-of-financial-charts-and-graphs-in-dark-mode/815d7dd2029d1d1fd751c747589712d8/>PikWizard</a>
</span>
</span>
<span class="image-link">
<span
style="margin: 0 0 20px 0; display: inline-block; vertical-align: middle; width: 100%;"
>
<a
target="_blank"
href="https://pikwizard.com/photo/digital-display-of-financial-charts-and-graphs-in-dark-mode/815d7dd2029d1d1fd751c747589712d8/"
style="text-decoration: none; font-size: 10px; margin: 0;"
>
<img src="https://pikwizard.com/pw/medium/815d7dd2029d1d1fd751c747589712d8.jpg" style="margin: 0; width: 100%;" alt="" />
<p style="font-size: 12px; margin: 0;">PikWizard</p>
</a>
</span>
</span>
Free (free of charge)
Free for personal and commercial use.
Author: Authentic Images
Similar Free Stock Images

Premium


Premium


Premium


Premium


Premium


Premium


Premium


Premium


Premium


Premium


Premium


Premium


Premium


Premium


Premium


Premium


Premium


Premium


Premium


Premium


Premium


Premium


Premium


Premium