- Home >
- Stock Photos >
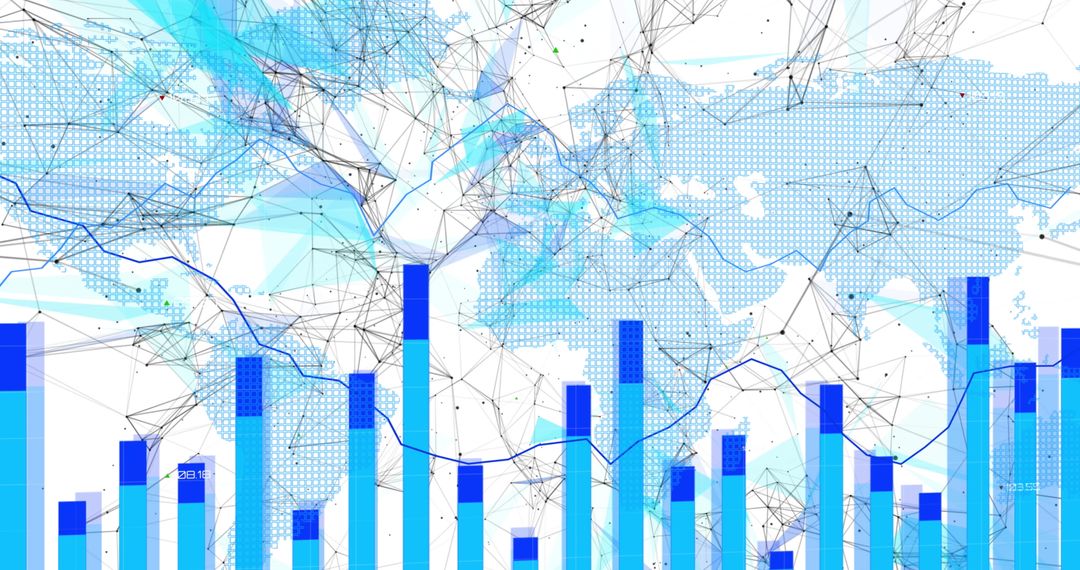
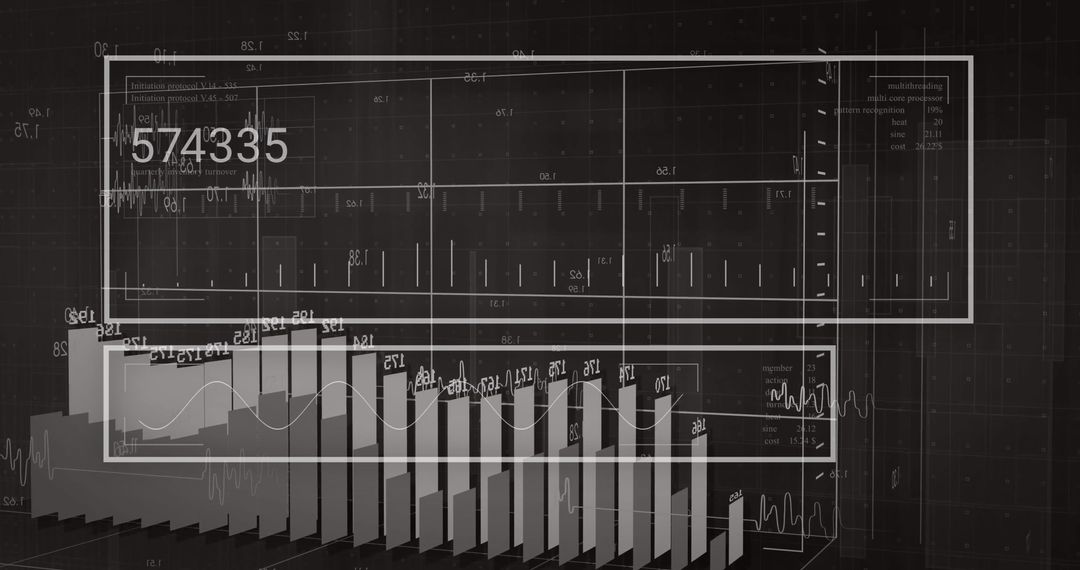
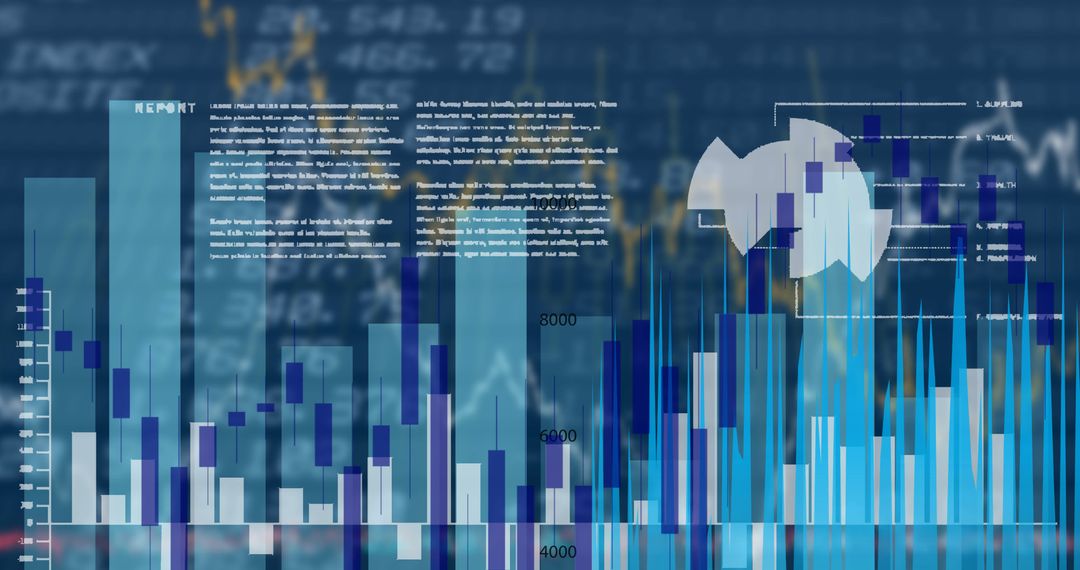
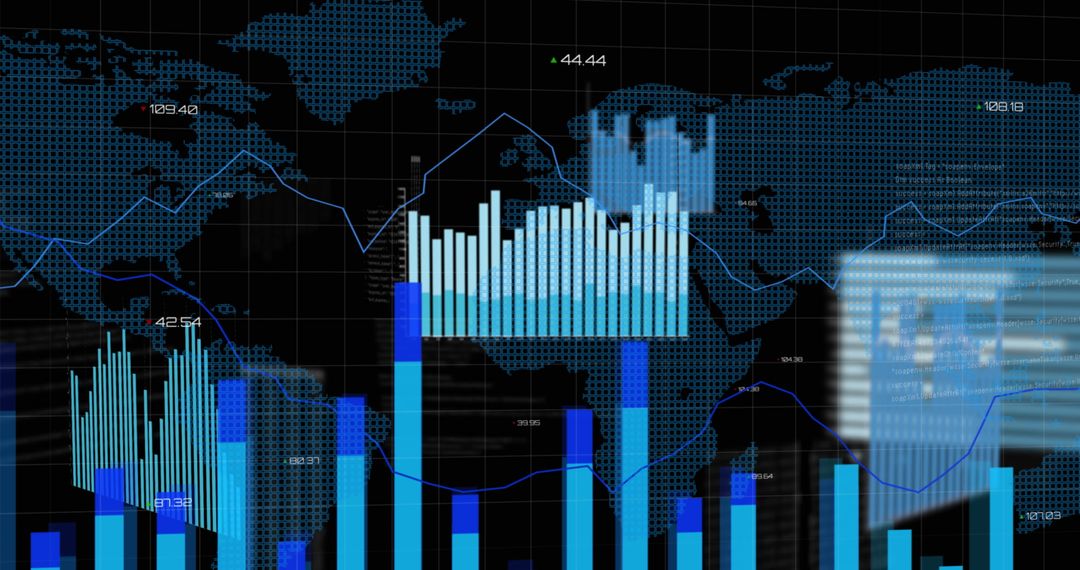
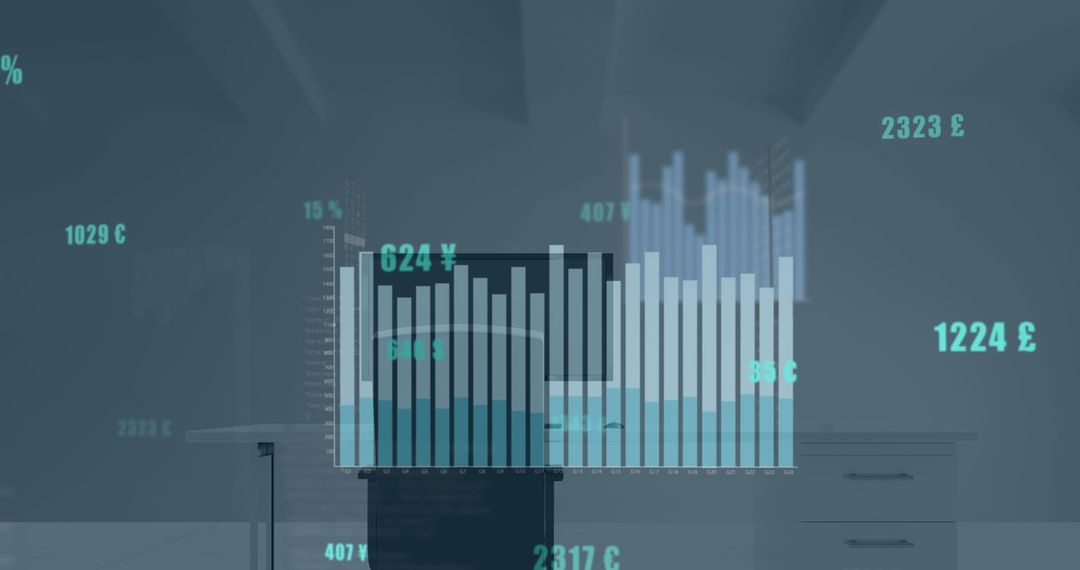
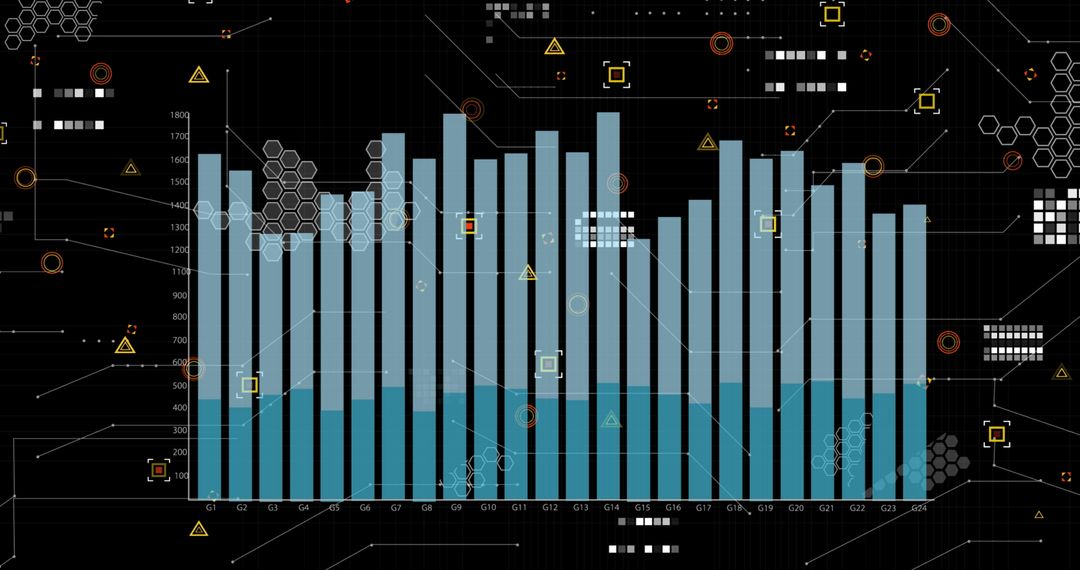
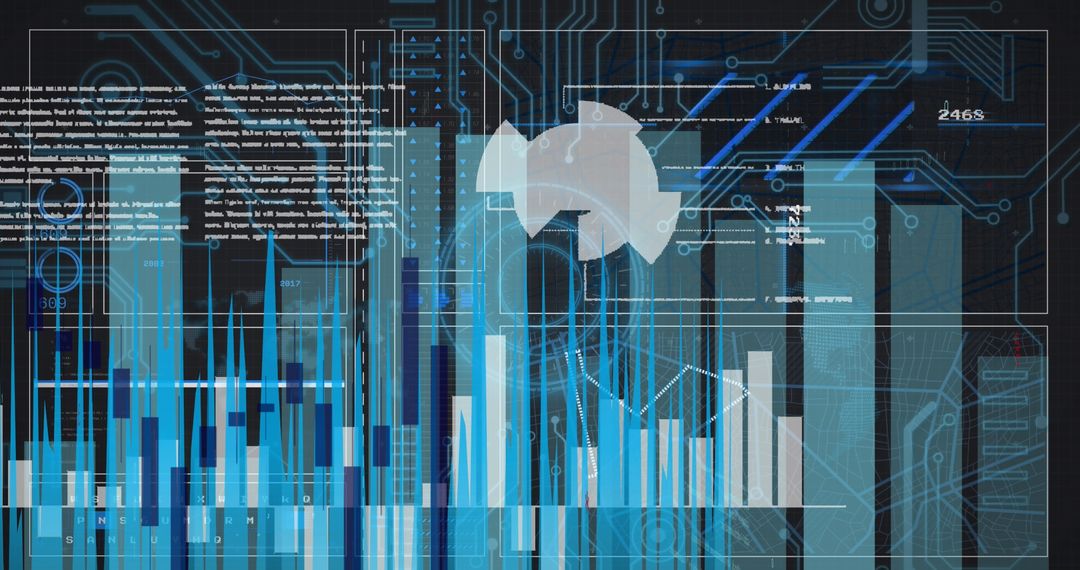
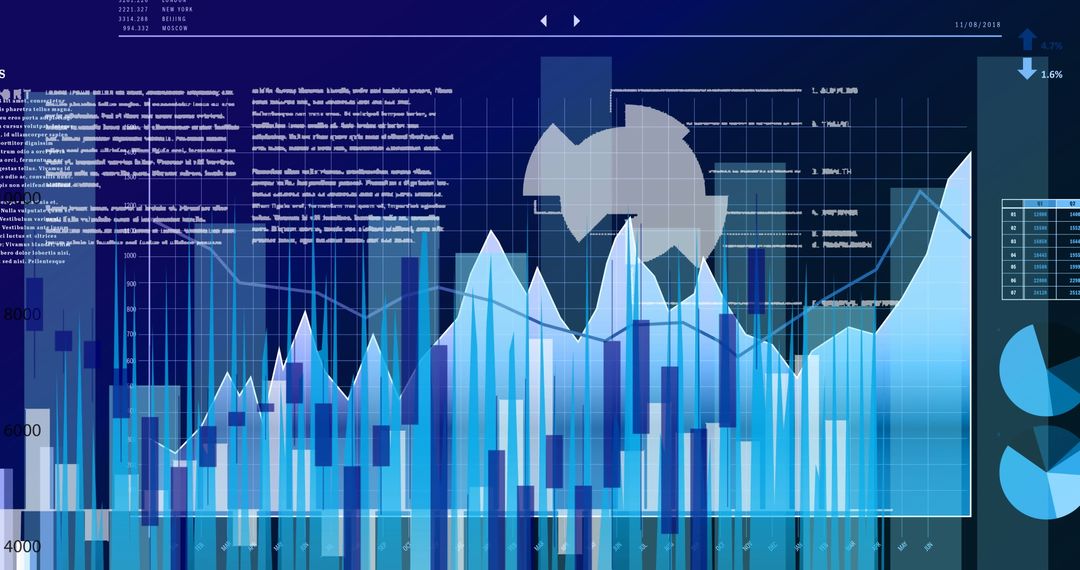
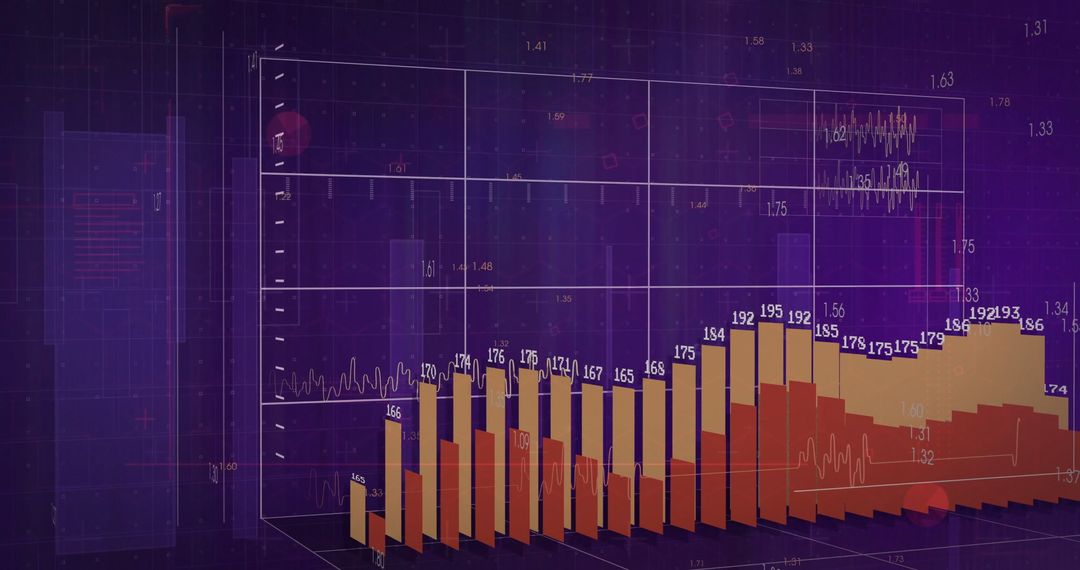
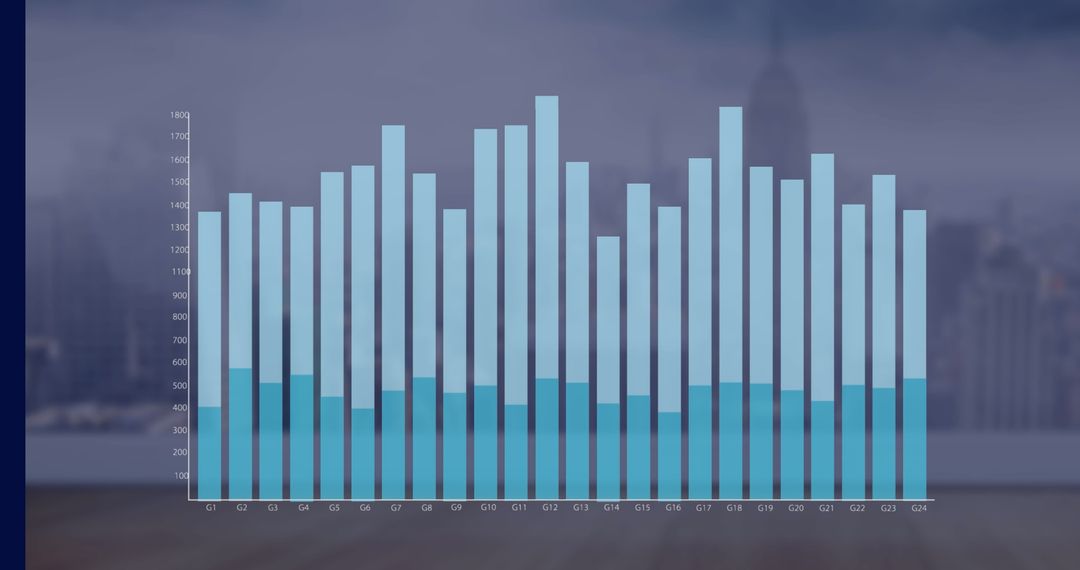
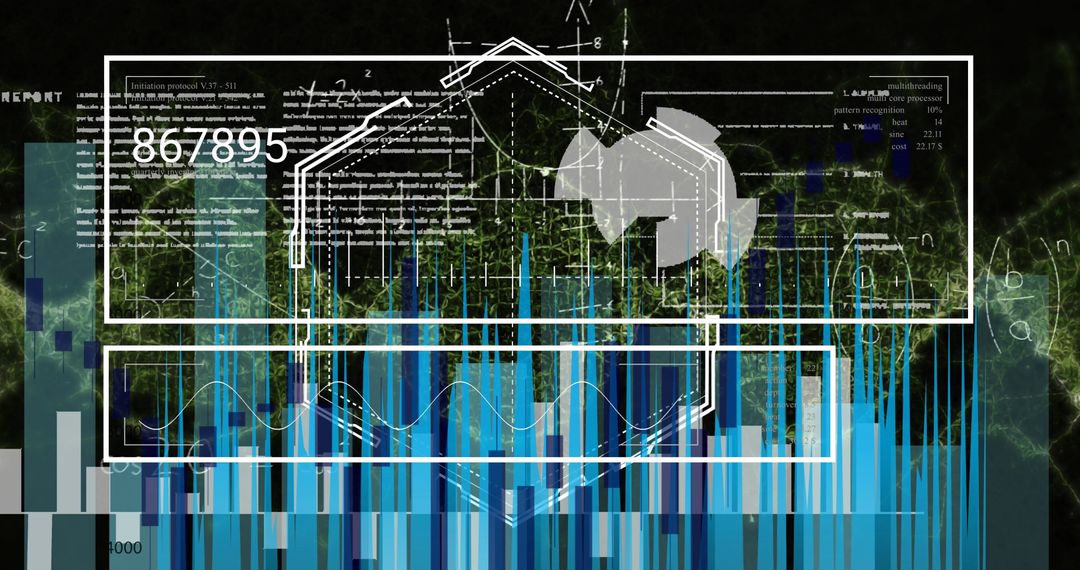
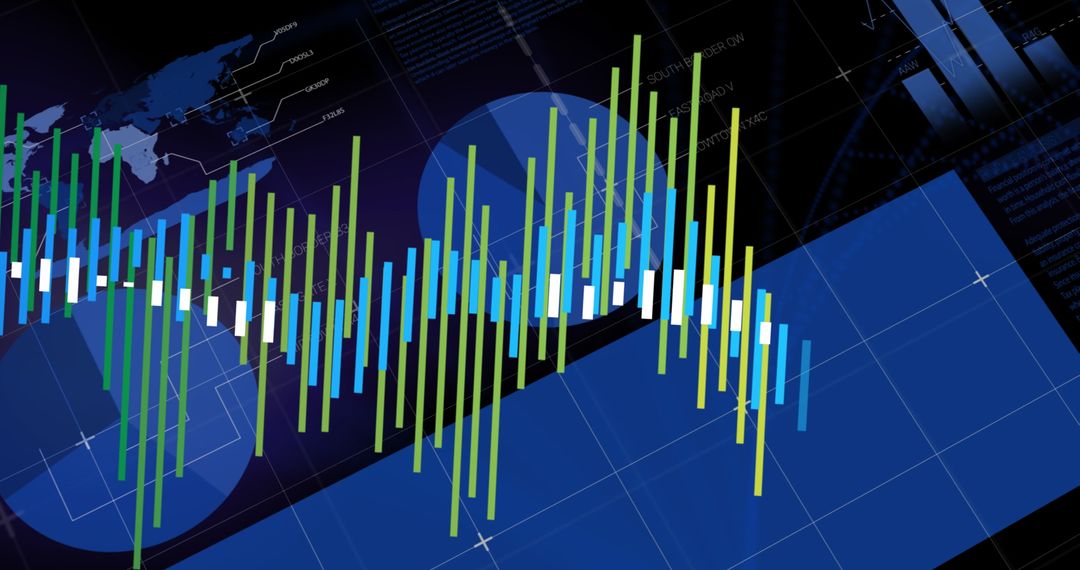
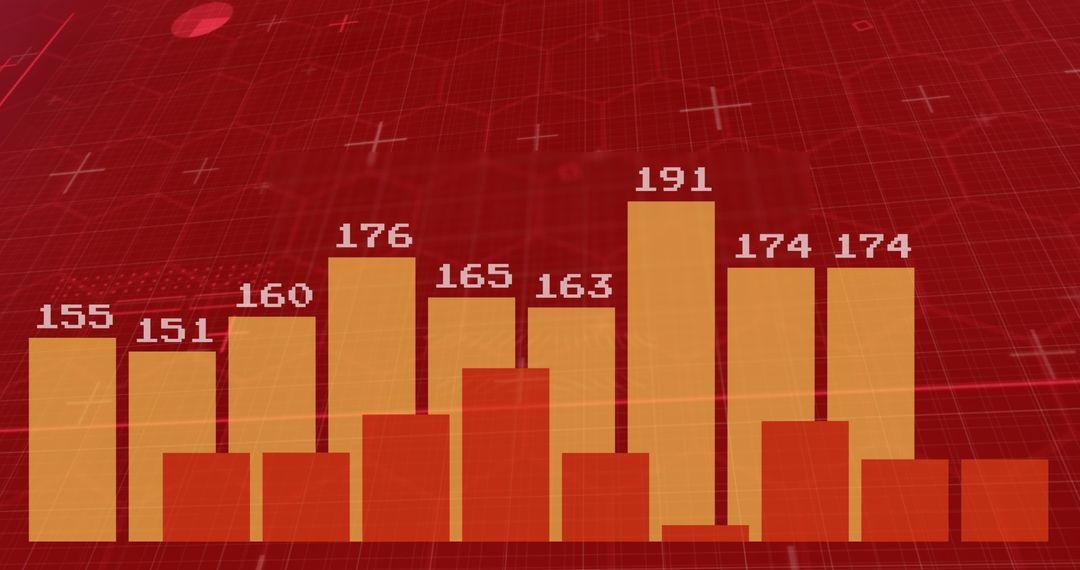
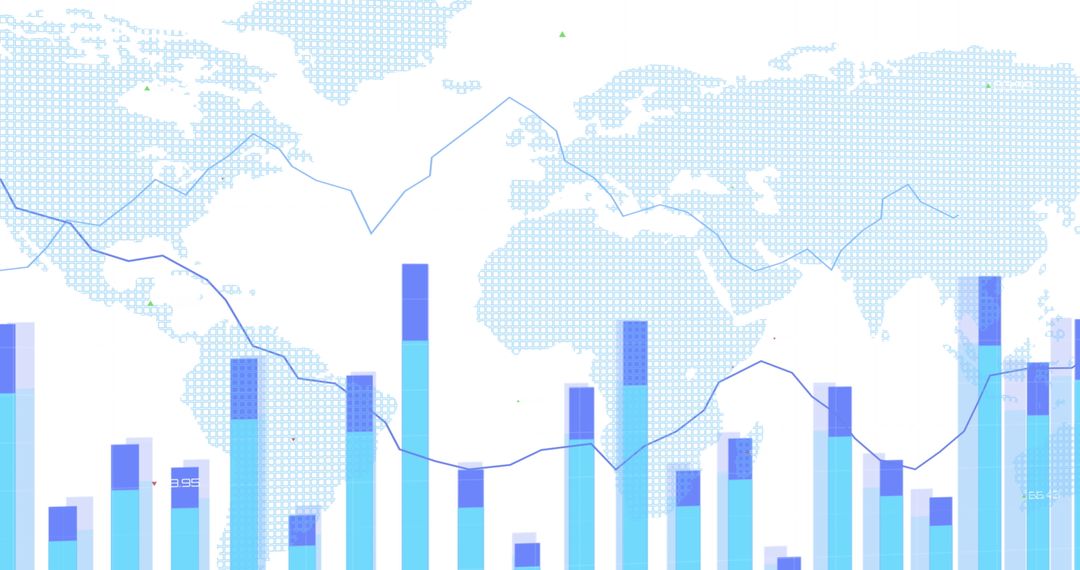
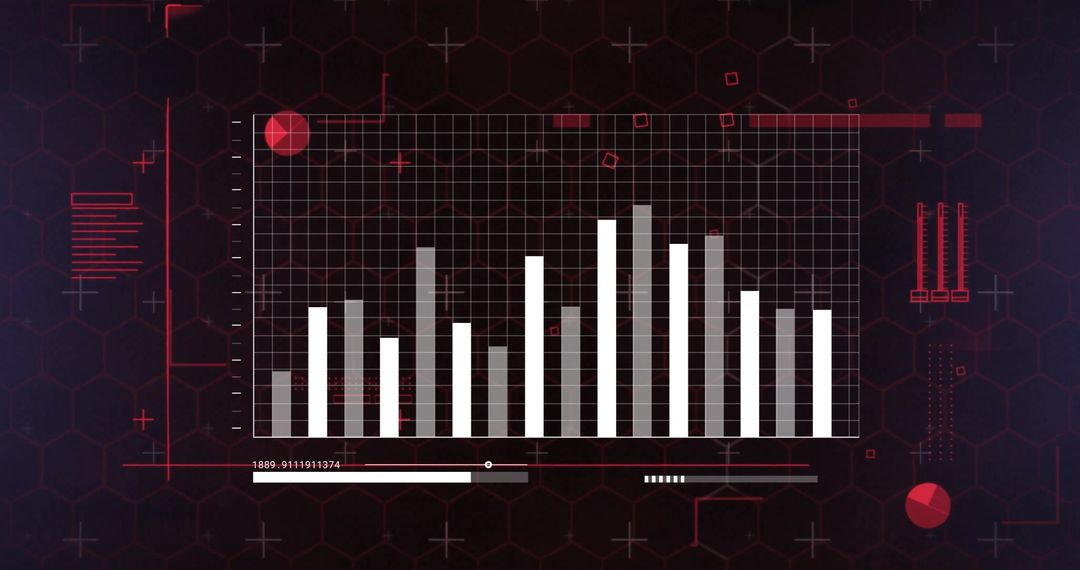
- Digital Display of Financial Data and Analytics with Bar Graph
Digital Display of Financial Data and Analytics with Bar Graph Image
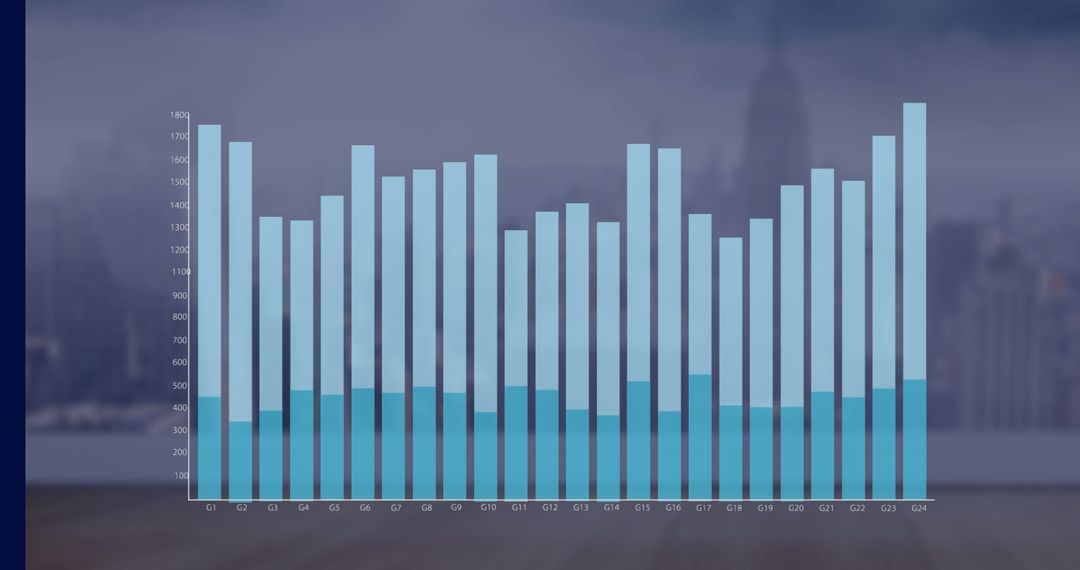
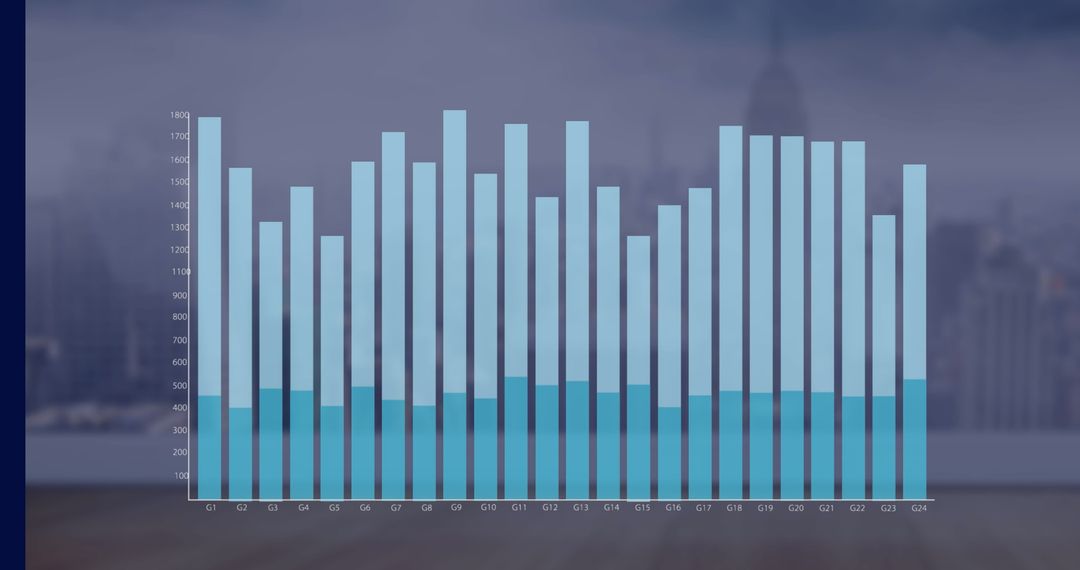
Abstract representation of complex financial data using graphical elements such as bar graphs, charts, and alphanumeric codes. Emphasizes digital technology in finance, useful for illustrating subjects such as financial analysis, business strategies, data insights presentations, and corporate environment displays.
Powered by  - Get 15% off with code: PIKWIZARD15


0
downloads
downloads
Tags:
More
Credit Photo
If you would like to credit the Photo, here are some ways you can do so
Text Link
photo Link
<span class="text-link">
<span>
<a target="_blank" href=https://pikwizard.com/photo/digital-display-of-financial-data-and-analytics-with-bar-graph/89ce2cc8dc85d6d86c2048f911fb573a/>PikWizard</a>
</span>
</span>
<span class="image-link">
<span
style="margin: 0 0 20px 0; display: inline-block; vertical-align: middle; width: 100%;"
>
<a
target="_blank"
href="https://pikwizard.com/photo/digital-display-of-financial-data-and-analytics-with-bar-graph/89ce2cc8dc85d6d86c2048f911fb573a/"
style="text-decoration: none; font-size: 10px; margin: 0;"
>
<img src="https://pikwizard.com/pw/medium/89ce2cc8dc85d6d86c2048f911fb573a.jpg" style="margin: 0; width: 100%;" alt="" />
<p style="font-size: 12px; margin: 0;">PikWizard</p>
</a>
</span>
</span>
Free (free of charge)
Free for personal and commercial use.
Author: Awesome Content
Similar Free Stock Images
Premium


Premium


Premium


Premium


Premium


Premium

Premium


Premium


Premium


Premium

Premium


Premium


Premium


Premium


Premium


Premium


Premium


Premium


Premium


Premium


Premium


Premium


Premium


Premium