- Home >
- Stock Photos >
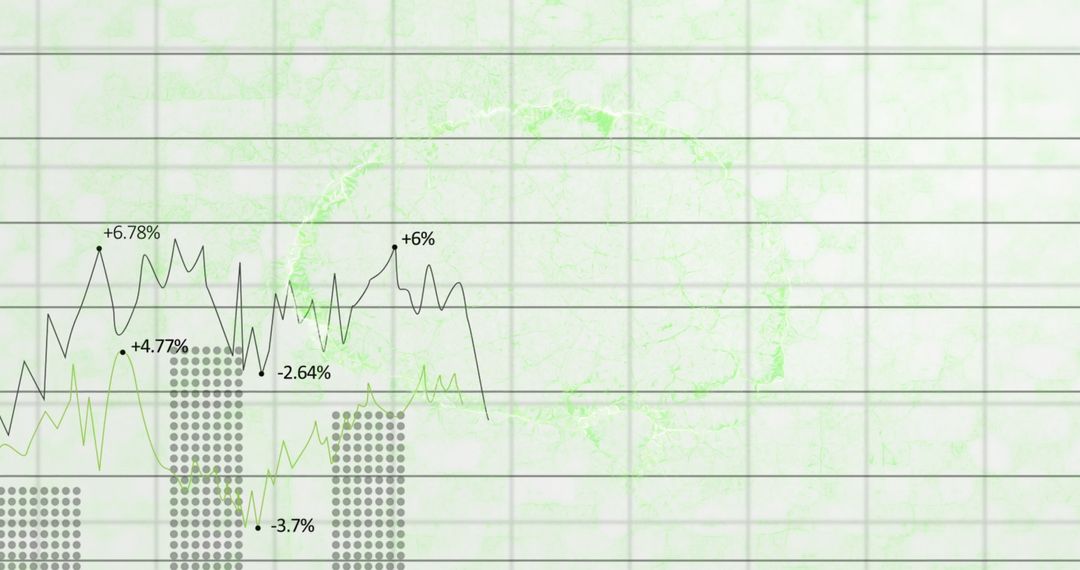
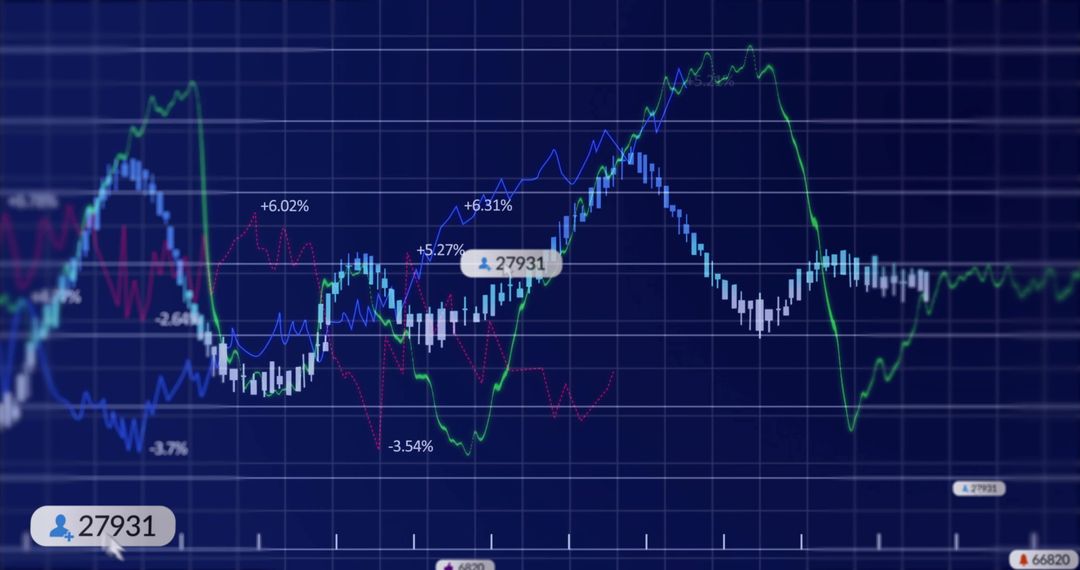
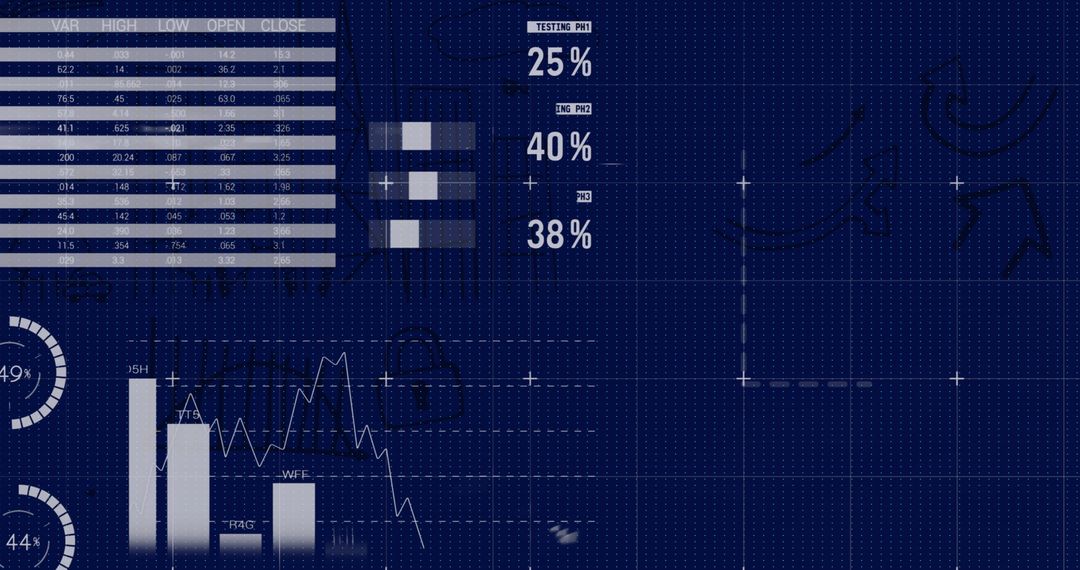
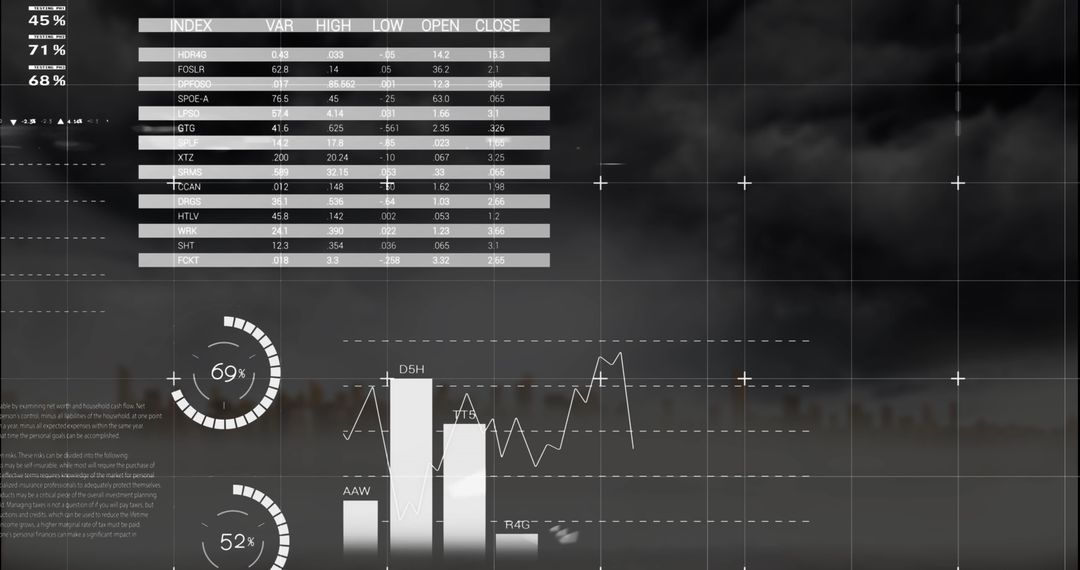
- Digital Display of Financial Data and Statistics
Digital Display of Financial Data and Statistics Image

Vibrant visuals portray financial statistics and data, shifting across a digital blue canvas. Imagery of various charts and graphs signifies complex business analysis and exchanges common in global finance for a technological audit report slide deck or dynamic keynote. Companies can leverage this image for marketing related to economic insights or financial services.
Powered by 


2
downloads
downloads
Tags:
More
Credit Photo
If you would like to credit the Photo, here are some ways you can do so
Text Link
photo Link
<span class="text-link">
<span>
<a target="_blank" href=https://pikwizard.com/photo/digital-display-of-financial-data-and-statistics/a414f91b8d5e10e115879000c7cf27d3/>PikWizard</a>
</span>
</span>
<span class="image-link">
<span
style="margin: 0 0 20px 0; display: inline-block; vertical-align: middle; width: 100%;"
>
<a
target="_blank"
href="https://pikwizard.com/photo/digital-display-of-financial-data-and-statistics/a414f91b8d5e10e115879000c7cf27d3/"
style="text-decoration: none; font-size: 10px; margin: 0;"
>
<img src="https://pikwizard.com/pw/medium/a414f91b8d5e10e115879000c7cf27d3.jpg" style="margin: 0; width: 100%;" alt="" />
<p style="font-size: 12px; margin: 0;">PikWizard</p>
</a>
</span>
</span>
Free (free of charge)
Free for personal and commercial use.
Author: Awesome Content
Similar Free Stock Images

Premium


Premium


Premium


Premium


Premium


Premium


Premium


Premium


Premium


Premium


Premium


Premium


Premium


Premium


Premium


Premium


Premium


Premium


Premium


Premium


Premium


Premium


Premium


Premium