
- Home >
- Stock Photos >
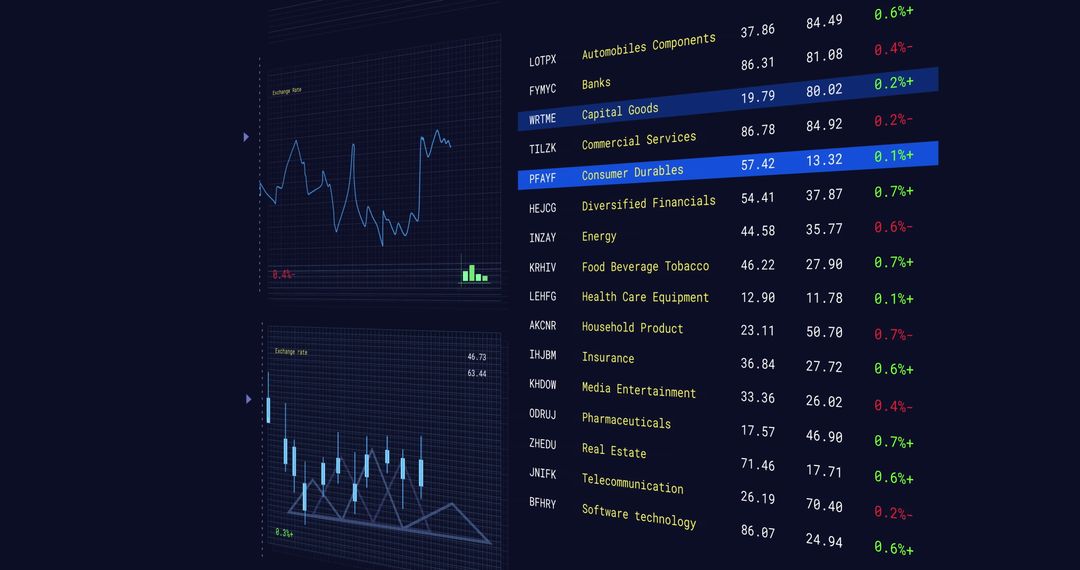
- Digital Display of Financial Data on Black Background
Digital Display of Financial Data on Black Background Image
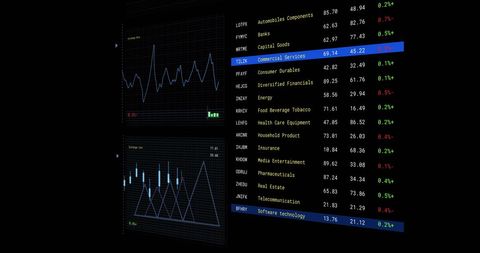
This image shows a digital display of various financial statistics set against a black background, representing global financial markets and analysis. Ideal for illustrating financial technology, stock market reports, or business analysis content. Suitable for use in financial blogs, investment websites, and business presentations to convey professional and technological themes.
Powered by 


2
downloads
downloads
Tags:
More
Credit Photo
If you would like to credit the Photo, here are some ways you can do so
Text Link
photo Link
<span class="text-link">
<span>
<a target="_blank" href=https://pikwizard.com/photo/digital-display-of-financial-data-on-black-background/a56043fc703ddf92698a74ef1e12436c/>PikWizard</a>
</span>
</span>
<span class="image-link">
<span
style="margin: 0 0 20px 0; display: inline-block; vertical-align: middle; width: 100%;"
>
<a
target="_blank"
href="https://pikwizard.com/photo/digital-display-of-financial-data-on-black-background/a56043fc703ddf92698a74ef1e12436c/"
style="text-decoration: none; font-size: 10px; margin: 0;"
>
<img src="https://pikwizard.com/pw/medium/a56043fc703ddf92698a74ef1e12436c.jpg" style="margin: 0; width: 100%;" alt="" />
<p style="font-size: 12px; margin: 0;">PikWizard</p>
</a>
</span>
</span>
Free (free of charge)
Free for personal and commercial use.
Author: Awesome Content
Similar Free Stock Images

Premium


Premium


Premium


Premium


Premium


Premium


Premium


Premium


Premium


Premium


Premium


Premium


Premium


Premium


Premium


Premium


Premium


Premium


Premium


Premium


Premium


Premium


Premium


Premium

