- Home >
- Stock Photos >
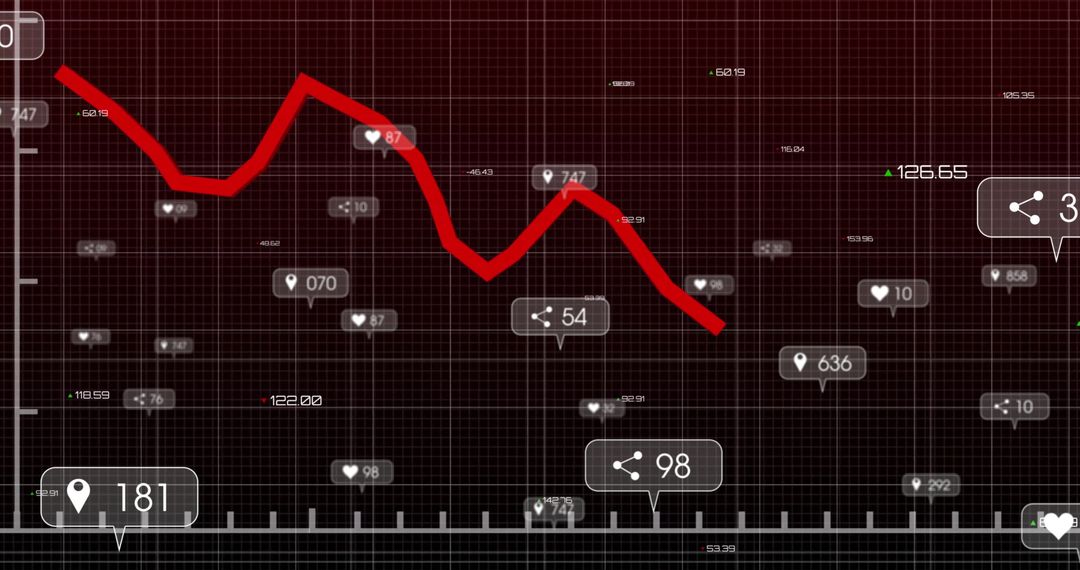
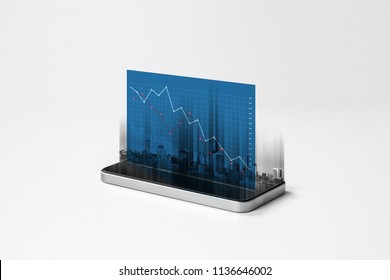
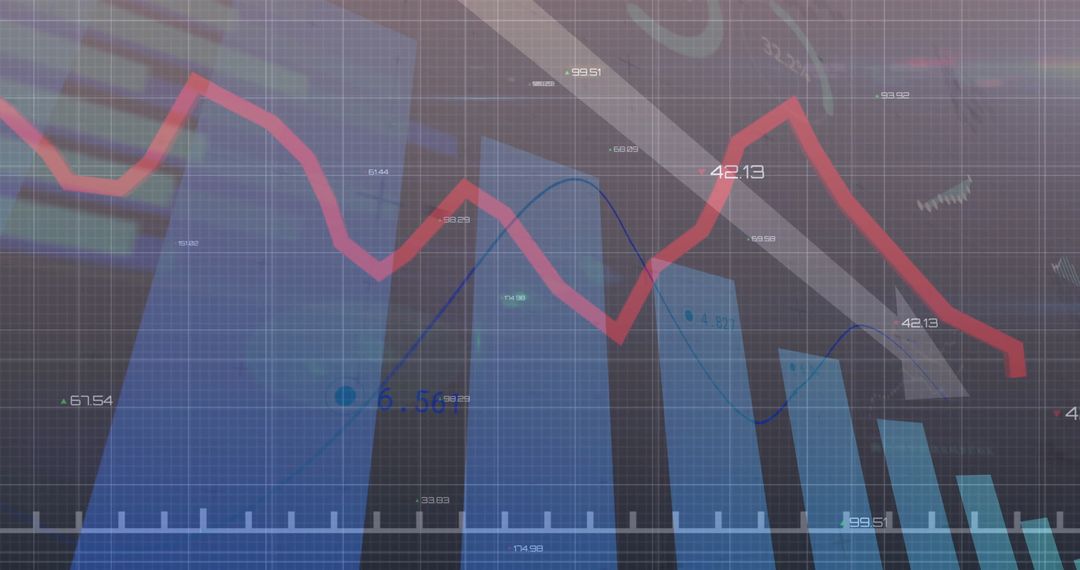
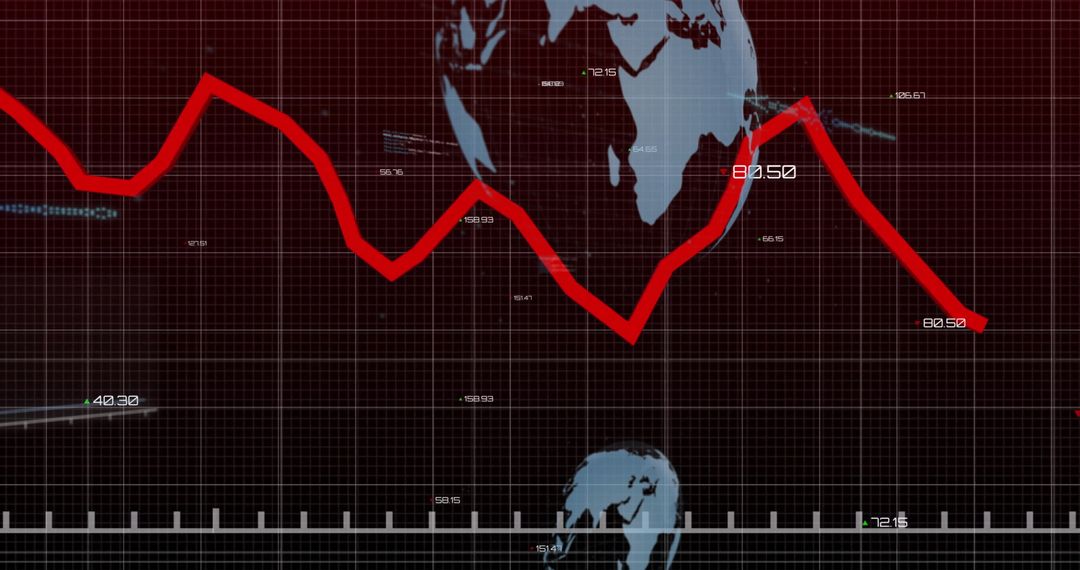
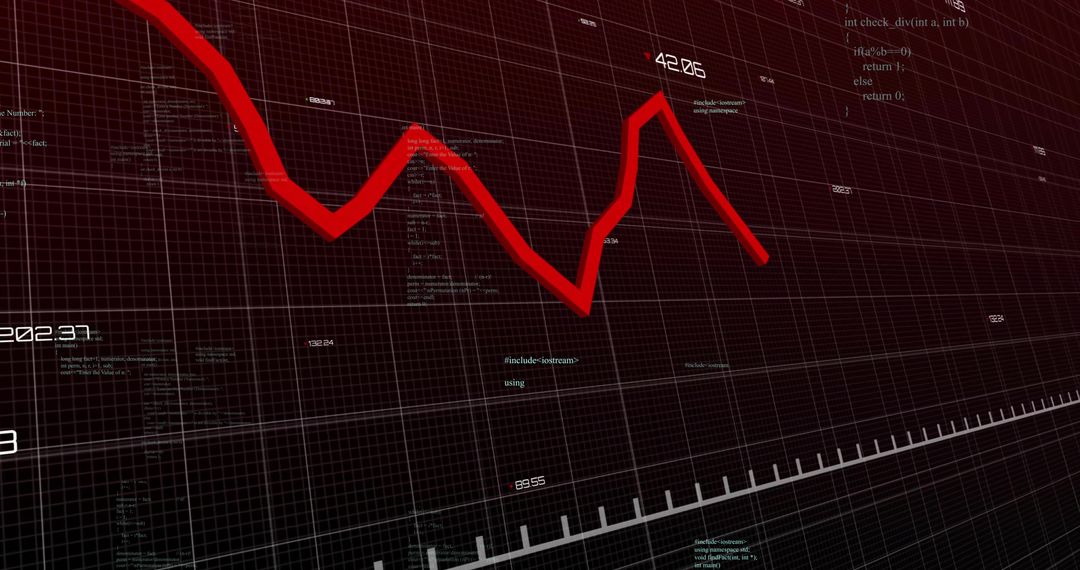
- Digital Display of Financial Decline Graph and Data Connectivity
Digital Display of Financial Decline Graph and Data Connectivity Image

Depicts financial data and statistics with a red line graph descending against a digital background, illustrating profit or economic downturns with complex connections and numerical data. Ideal for illustrating concepts in finance, analytics, global markets, economic analysis, or digital technology interpretations in textbooks, articles, or financial reports. Suitable for discussing strategies in business, market trends, or statistical data processing.
Powered by  - Get 15% off with code: PIKWIZARD15


0
downloads
downloads
Tags:
More
Credit Photo
If you would like to credit the Photo, here are some ways you can do so
Text Link
photo Link
<span class="text-link">
<span>
<a target="_blank" href=https://pikwizard.com/photo/digital-display-of-financial-decline-graph-and-data-connectivity/ad6223168189719e65d0c4eb902f4532/>PikWizard</a>
</span>
</span>
<span class="image-link">
<span
style="margin: 0 0 20px 0; display: inline-block; vertical-align: middle; width: 100%;"
>
<a
target="_blank"
href="https://pikwizard.com/photo/digital-display-of-financial-decline-graph-and-data-connectivity/ad6223168189719e65d0c4eb902f4532/"
style="text-decoration: none; font-size: 10px; margin: 0;"
>
<img src="https://pikwizard.com/pw/medium/ad6223168189719e65d0c4eb902f4532.jpg" style="margin: 0; width: 100%;" alt="" />
<p style="font-size: 12px; margin: 0;">PikWizard</p>
</a>
</span>
</span>
Free (free of charge)
Free for personal and commercial use.
Author: Creative Art
Similar Free Stock Images

Premium


Premium


Premium


Premium


Premium


Premium


Premium


Premium


Premium


Premium


Premium


Premium


Premium


Premium


Premium


Premium


Premium


Premium


Premium


Premium


Premium


Premium


Premium

Premium