- Home >
- Stock Photos >
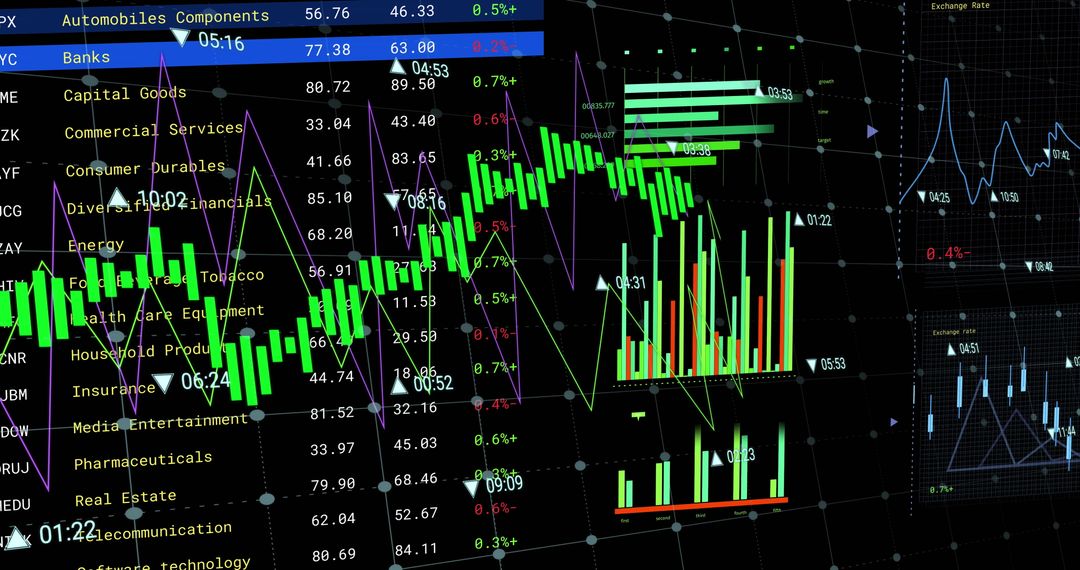
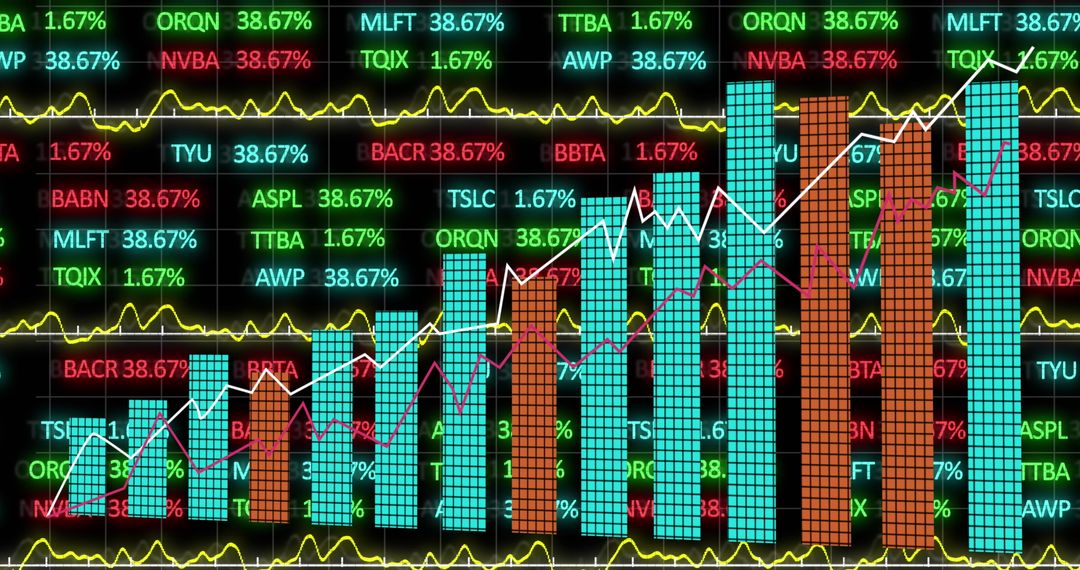
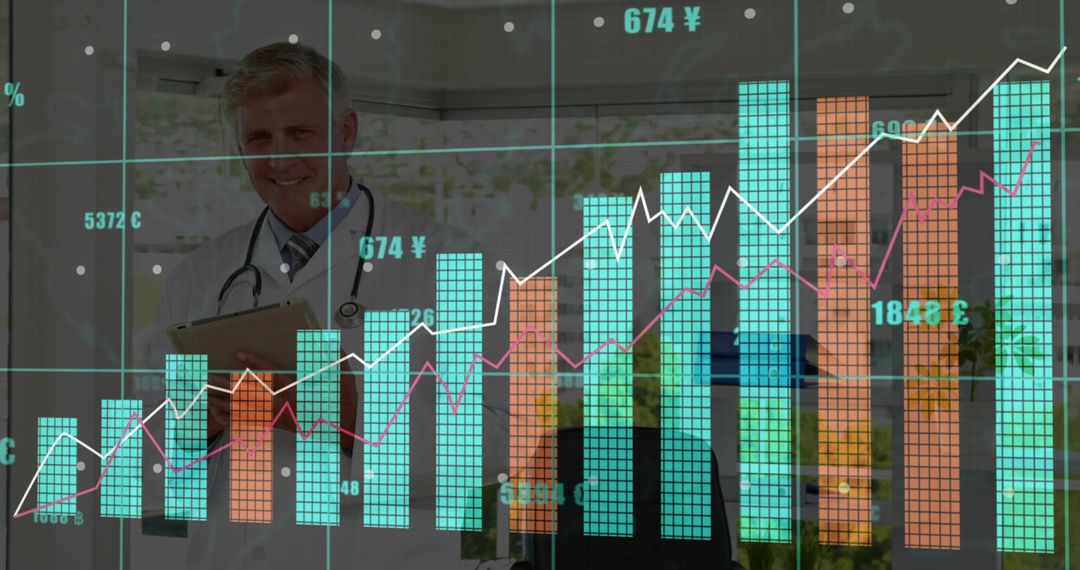
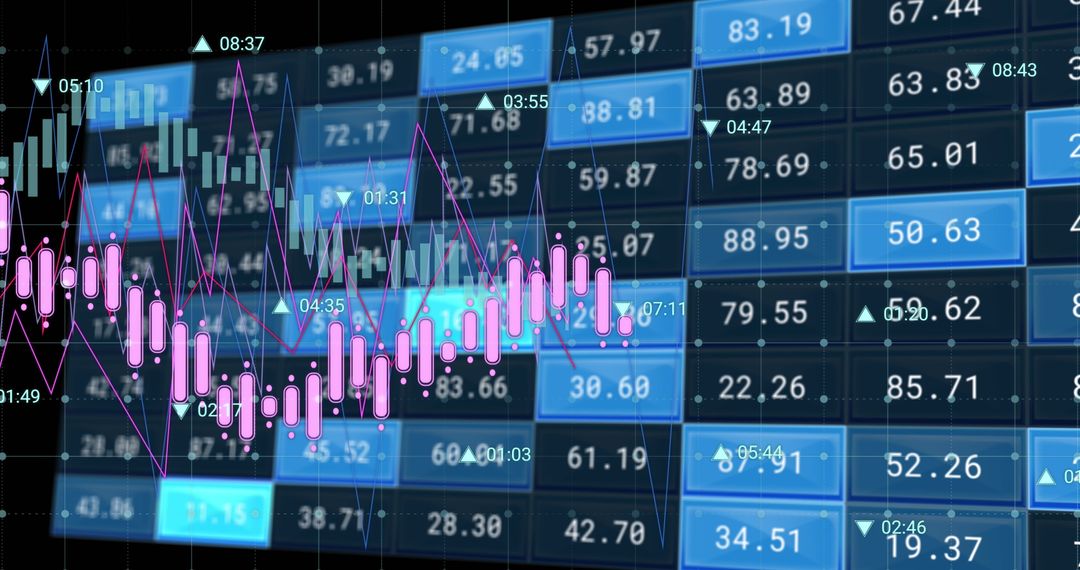
- Digital Display of Global Financial Data Process
Digital Display of Global Financial Data Process Image

Vibrant visual of financial data with various currency values on dark background. Useful for illustrating economic articles, financial reports, and business presentations. Ideal visual for topics related to data analysis, stock markets, and economic trends.
Powered by 


2
downloads
downloads
Tags:
More
Credit Photo
If you would like to credit the Photo, here are some ways you can do so
Text Link
photo Link
<span class="text-link">
<span>
<a target="_blank" href=https://pikwizard.com/photo/digital-display-of-global-financial-data-process/9fd2e01c6d6b826109ff9c0a2808dc38/>PikWizard</a>
</span>
</span>
<span class="image-link">
<span
style="margin: 0 0 20px 0; display: inline-block; vertical-align: middle; width: 100%;"
>
<a
target="_blank"
href="https://pikwizard.com/photo/digital-display-of-global-financial-data-process/9fd2e01c6d6b826109ff9c0a2808dc38/"
style="text-decoration: none; font-size: 10px; margin: 0;"
>
<img src="https://pikwizard.com/pw/medium/9fd2e01c6d6b826109ff9c0a2808dc38.jpg" style="margin: 0; width: 100%;" alt="" />
<p style="font-size: 12px; margin: 0;">PikWizard</p>
</a>
</span>
</span>
Free (free of charge)
Free for personal and commercial use.
Author: Authentic Images
Similar Free Stock Images

Premium


Premium


Premium


Premium


Premium


Premium


Premium


Premium


Premium


Premium


Premium


Premium


Premium


Premium


Premium


Premium


Premium


Premium


Premium


Premium


Premium


Premium


Premium


Premium