- Home >
- Stock Photos >
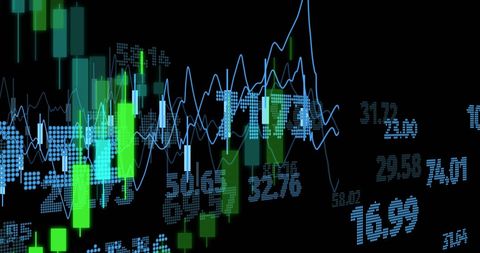
- Digital Display of Inflation Concept Over Financial Trends Chart
Digital Display of Inflation Concept Over Financial Trends Chart Image

Dynamic representation of inflation using digital characters prominently featured overlaid on financial graphs. Ideal for illustrating articles or presentations about global economic trends and fiscal policy. Suitable for financial analyses, investment discussions, or educational material highlighting aspects of market fluctuations.
Powered by  - Get 15% off with code: PIKWIZARD15


2
downloads
downloads
Tags:
More
Credit Photo
If you would like to credit the Photo, here are some ways you can do so
Text Link
photo Link
<span class="text-link">
<span>
<a target="_blank" href=https://pikwizard.com/photo/digital-display-of-inflation-concept-over-financial-trends-chart/72095dfde526d8098ea09a5c18c674a8/>PikWizard</a>
</span>
</span>
<span class="image-link">
<span
style="margin: 0 0 20px 0; display: inline-block; vertical-align: middle; width: 100%;"
>
<a
target="_blank"
href="https://pikwizard.com/photo/digital-display-of-inflation-concept-over-financial-trends-chart/72095dfde526d8098ea09a5c18c674a8/"
style="text-decoration: none; font-size: 10px; margin: 0;"
>
<img src="https://pikwizard.com/pw/medium/72095dfde526d8098ea09a5c18c674a8.jpg" style="margin: 0; width: 100%;" alt="" />
<p style="font-size: 12px; margin: 0;">PikWizard</p>
</a>
</span>
</span>
Free (free of charge)
Free for personal and commercial use.
Author: Creative Art
Similar Free Stock Images
Loading...

Premium


Premium


Premium


Premium


Premium


Premium


Premium

Premium


Premium


Premium

Premium


Premium

Premium


Premium

Premium
Premium


Premium

Premium


Premium

Premium


Premium


Premium


Premium


Premium


Premium