- Home >
- Stock Photos >
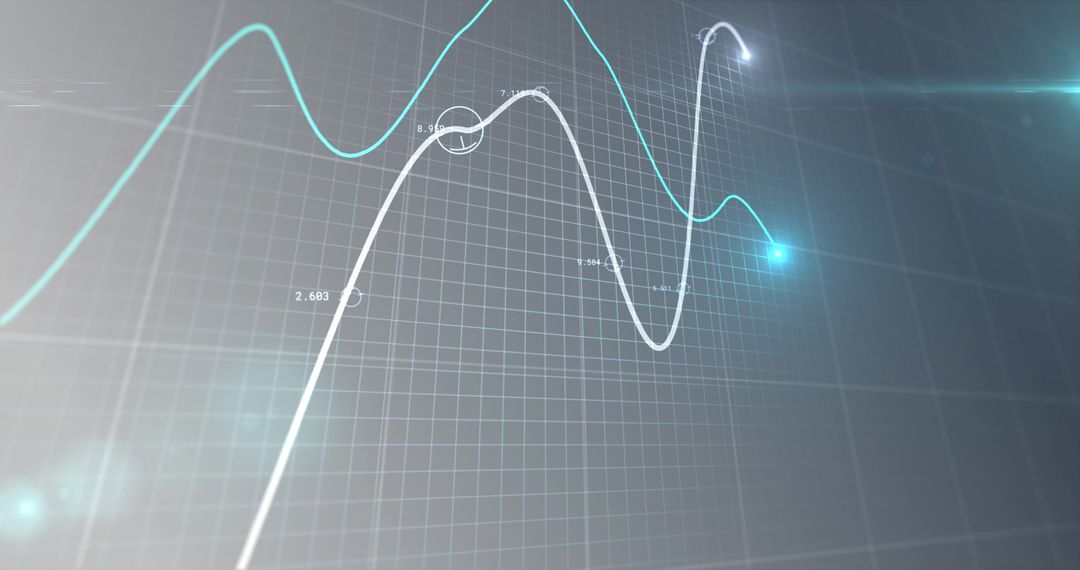
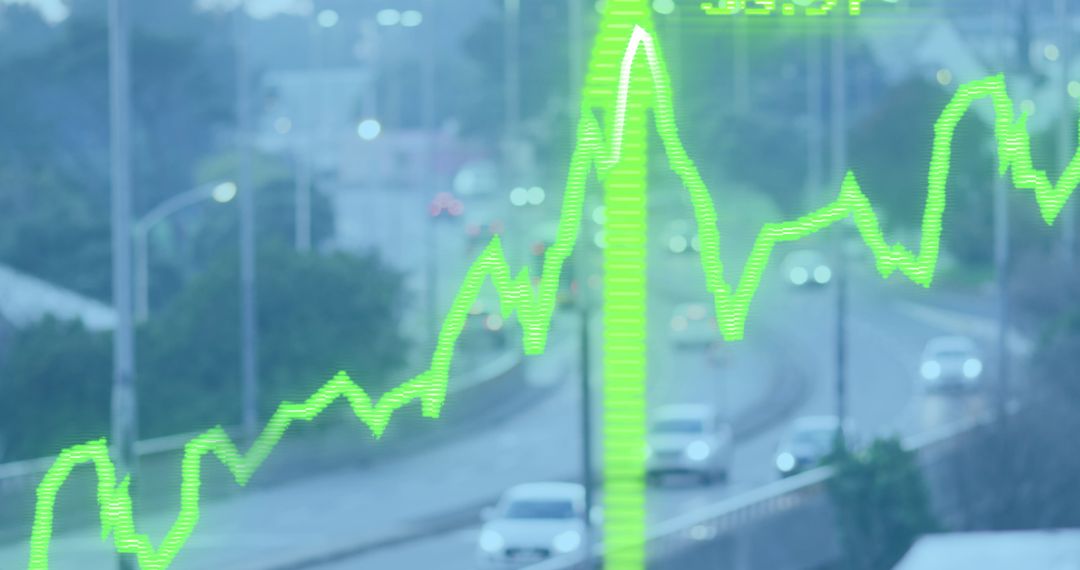
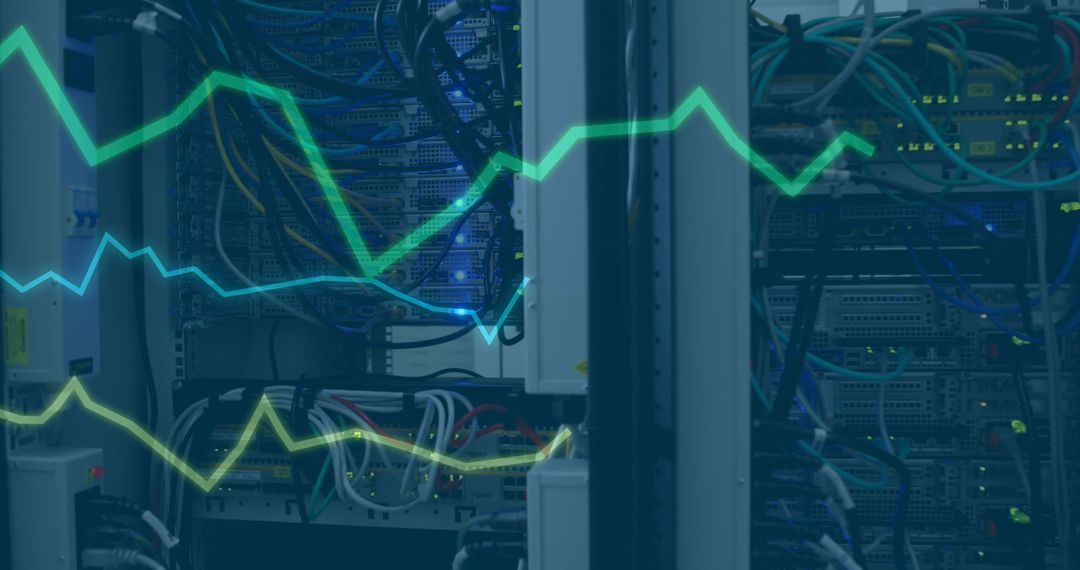
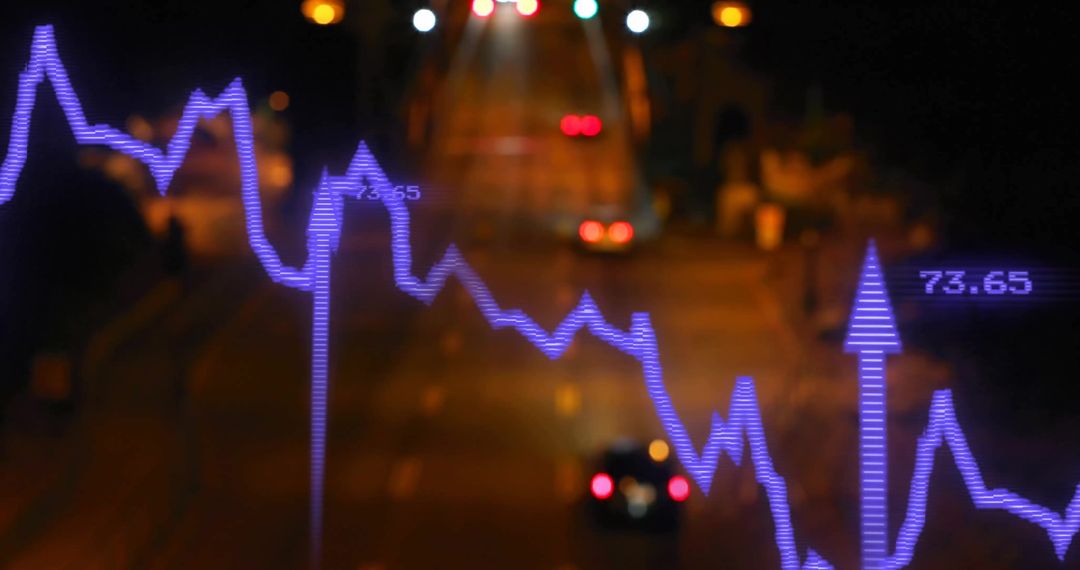
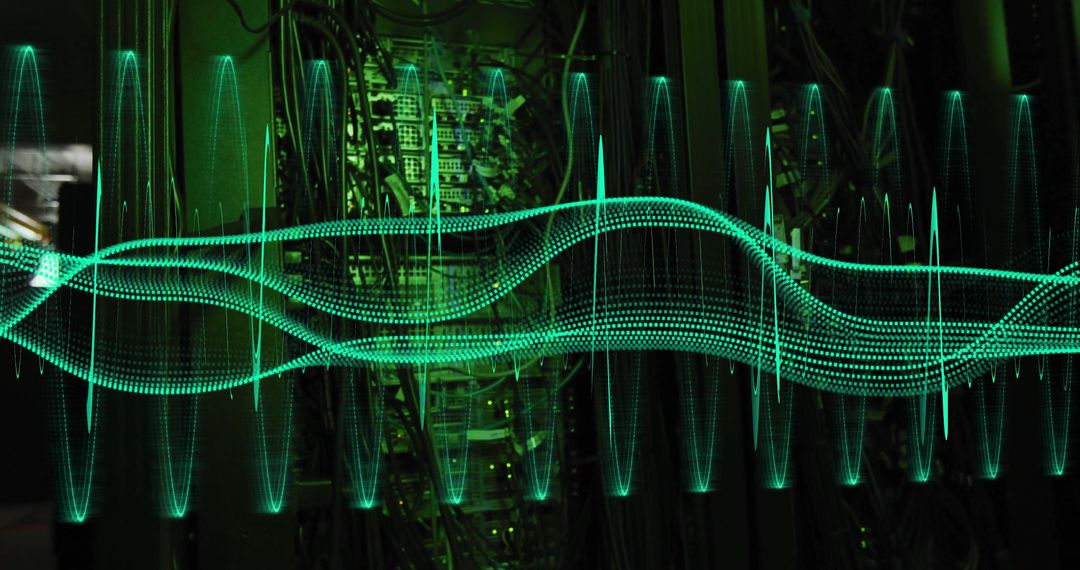
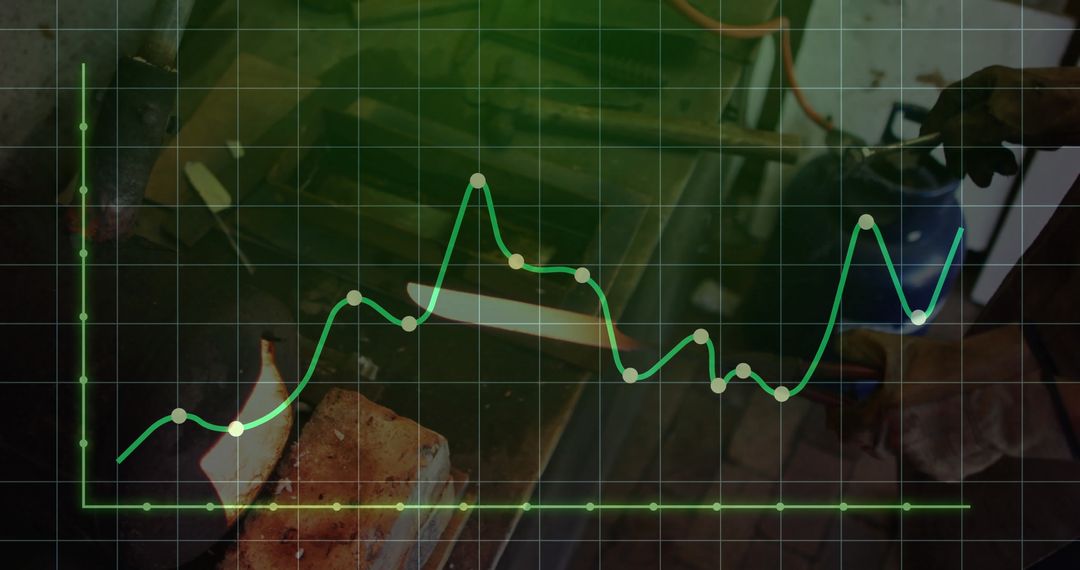
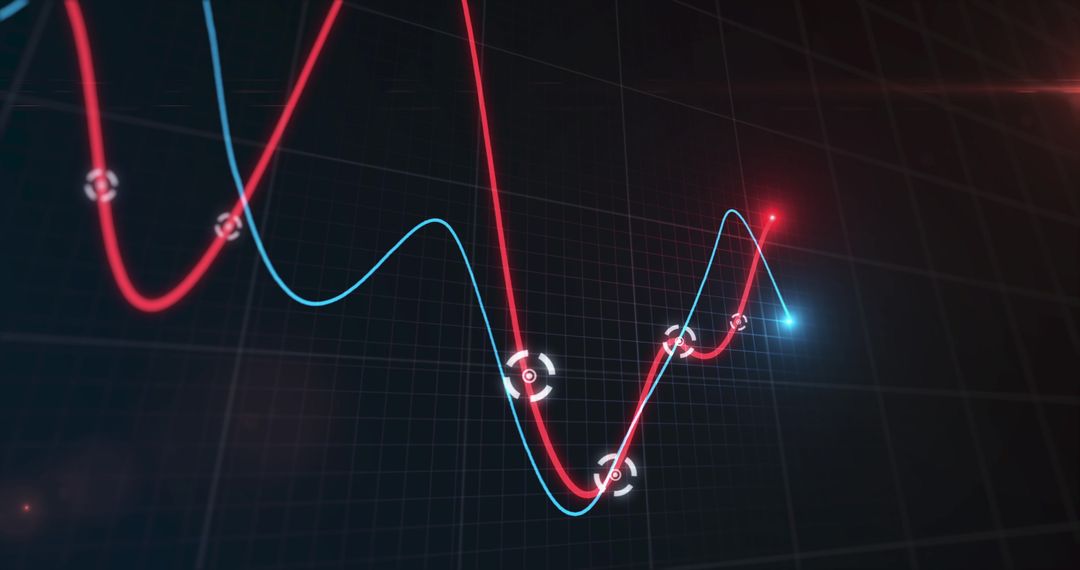
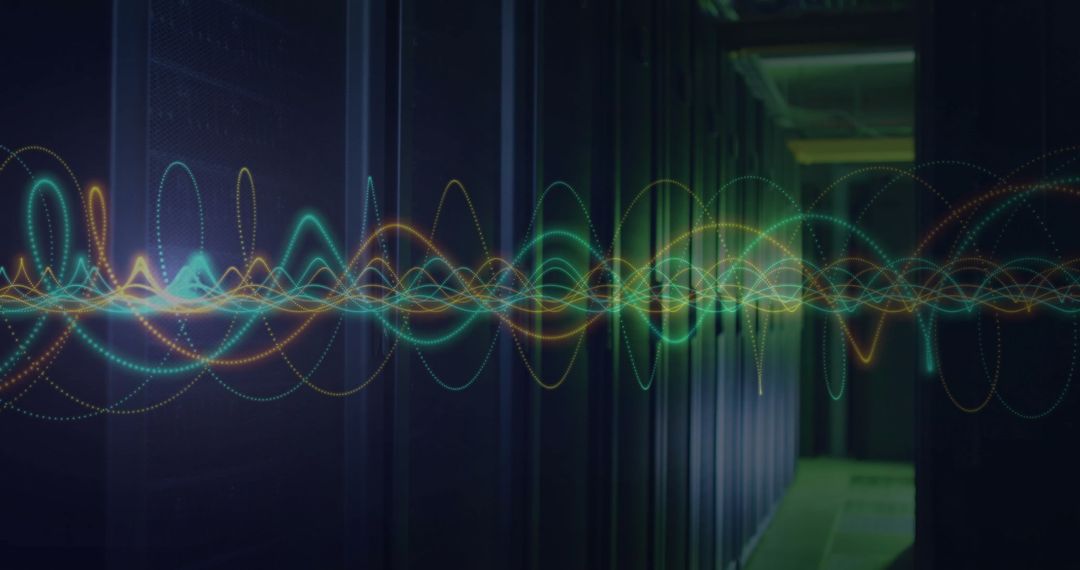
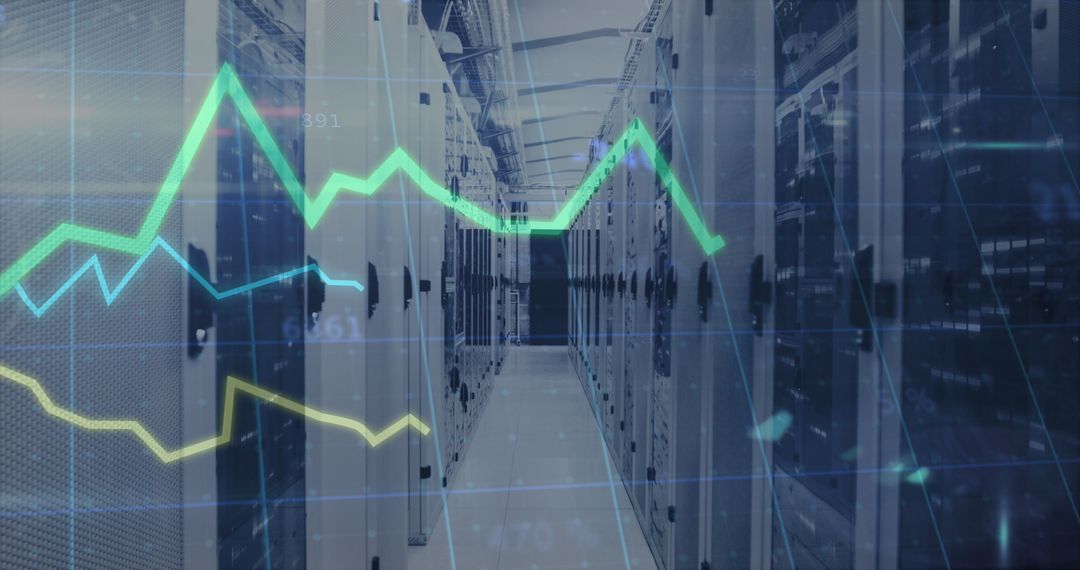
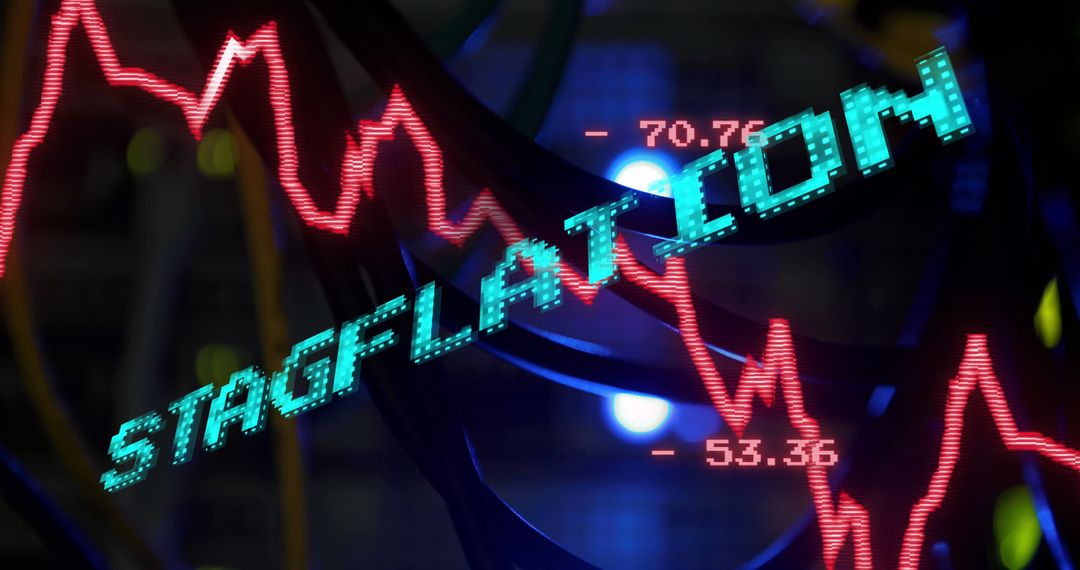
- Digital Display of Stagflation and Data Processing in Server Room
Digital Display of Stagflation and Data Processing in Server Room Image
Digital stagflation display over immersive server room visualizes economic changes and technological blending for impactful business analysis presentations. Perfect for use in financial articles, economic trend reports, and technology-focused content exploring data analytics or economic fluctuations.
Powered by 

4
downloads
downloads
Tags:
More
Credit Photo
If you would like to credit the Photo, here are some ways you can do so
Text Link
photo Link
<span class="text-link">
<span>
<a target="_blank" href=https://pikwizard.com/photo/digital-display-of-stagflation-and-data-processing-in-server-room/ab730501a5da0ce6377593b027b0d815/>PikWizard</a>
</span>
</span>
<span class="image-link">
<span
style="margin: 0 0 20px 0; display: inline-block; vertical-align: middle; width: 100%;"
>
<a
target="_blank"
href="https://pikwizard.com/photo/digital-display-of-stagflation-and-data-processing-in-server-room/ab730501a5da0ce6377593b027b0d815/"
style="text-decoration: none; font-size: 10px; margin: 0;"
>
<img src="https://pikwizard.com/pw/medium/ab730501a5da0ce6377593b027b0d815.jpg" style="margin: 0; width: 100%;" alt="" />
<p style="font-size: 12px; margin: 0;">PikWizard</p>
</a>
</span>
</span>
Free (free of charge)
Free for personal and commercial use.
Author: Authentic Images
Similar Free Stock Images