
- Home >
- Stock Photos >
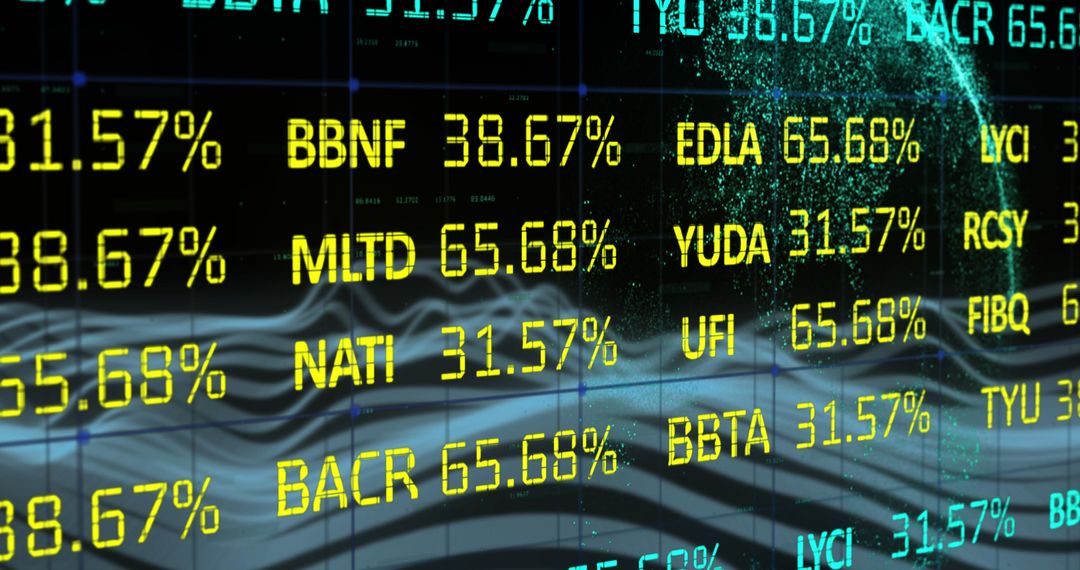
- Digital Display of Stock Market Data and Graphs
Digital Display of Stock Market Data and Graphs Image

The image features dynamic digital displays of stock market data with numerical information and graphs over a dark background, illustrating financial analysis. Useful for illustrating concepts related to global finance, business analytics, investment strategies or economics. Ideal for financial reports, business presentations or educational purposes focused on economics and stock trading.
Powered by 


2
downloads
downloads
Tags:
More
Credit Photo
If you would like to credit the Photo, here are some ways you can do so
Text Link
photo Link
<span class="text-link">
<span>
<a target="_blank" href=https://pikwizard.com/photo/digital-display-of-stock-market-data-and-graphs/8259db3fcfcbce713bed1f12631e660d/>PikWizard</a>
</span>
</span>
<span class="image-link">
<span
style="margin: 0 0 20px 0; display: inline-block; vertical-align: middle; width: 100%;"
>
<a
target="_blank"
href="https://pikwizard.com/photo/digital-display-of-stock-market-data-and-graphs/8259db3fcfcbce713bed1f12631e660d/"
style="text-decoration: none; font-size: 10px; margin: 0;"
>
<img src="https://pikwizard.com/pw/medium/8259db3fcfcbce713bed1f12631e660d.jpg" style="margin: 0; width: 100%;" alt="" />
<p style="font-size: 12px; margin: 0;">PikWizard</p>
</a>
</span>
</span>
Free (free of charge)
Free for personal and commercial use.
Author: Awesome Content
Similar Free Stock Images

Premium


Premium


Premium


Premium


Premium


Premium


Premium


Premium


Premium


Premium


Premium


Premium


Premium


Premium


Premium


Premium


Premium


Premium


Premium


Premium


Premium


Premium


Premium


Premium

