- Home >
- Stock Photos >
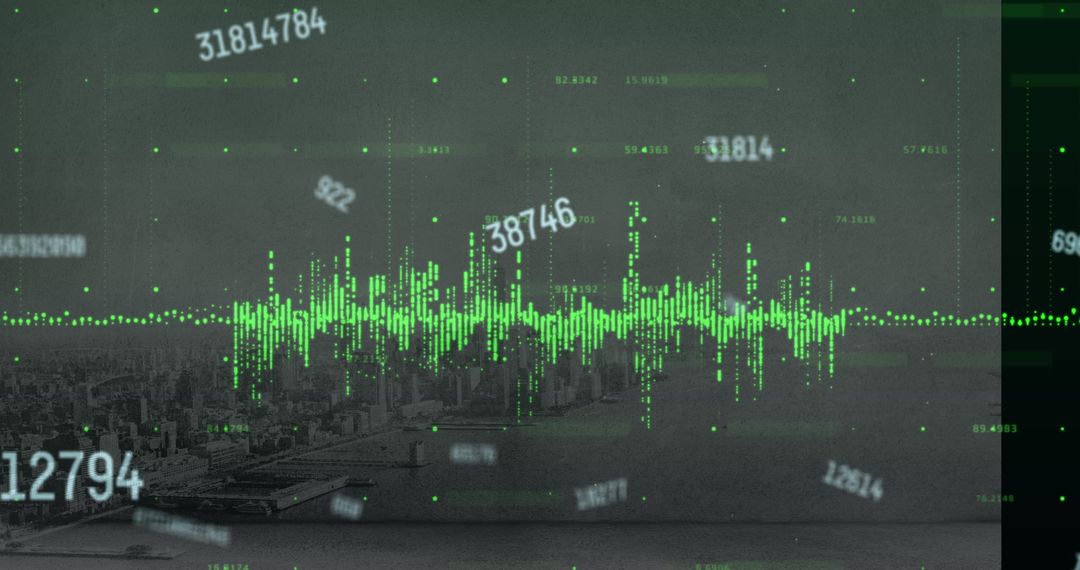
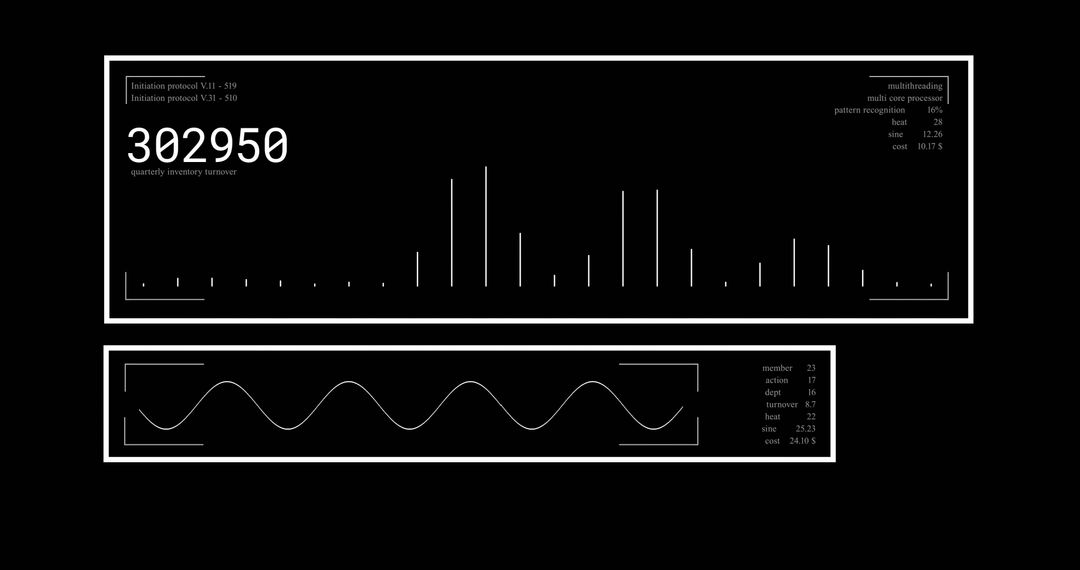
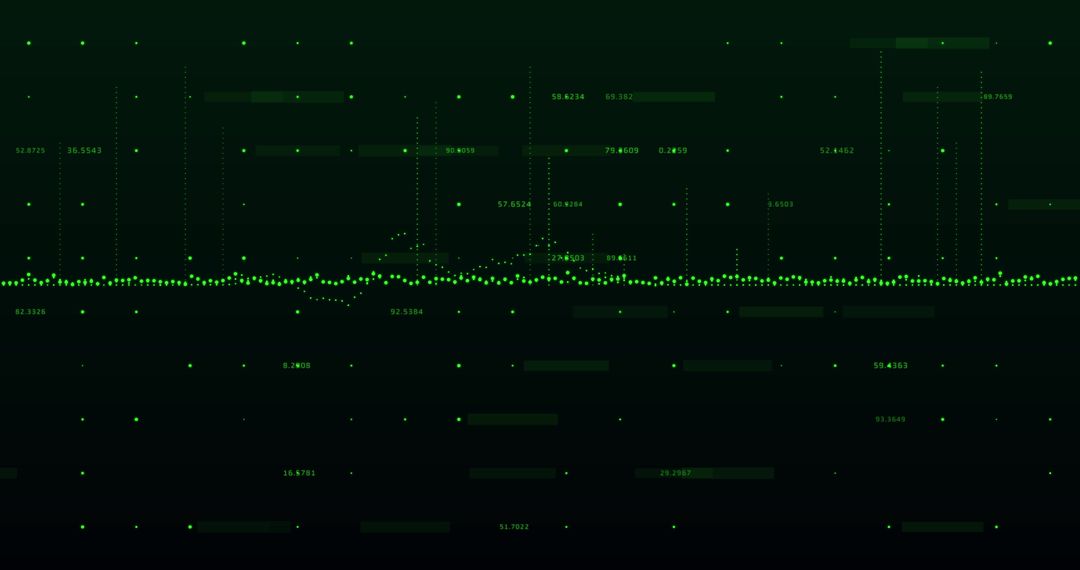
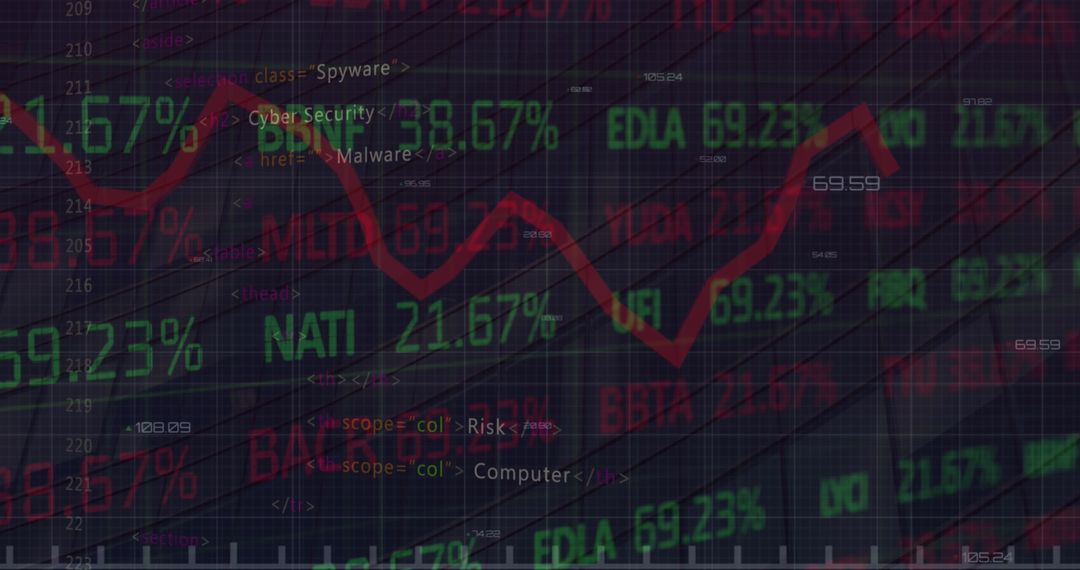
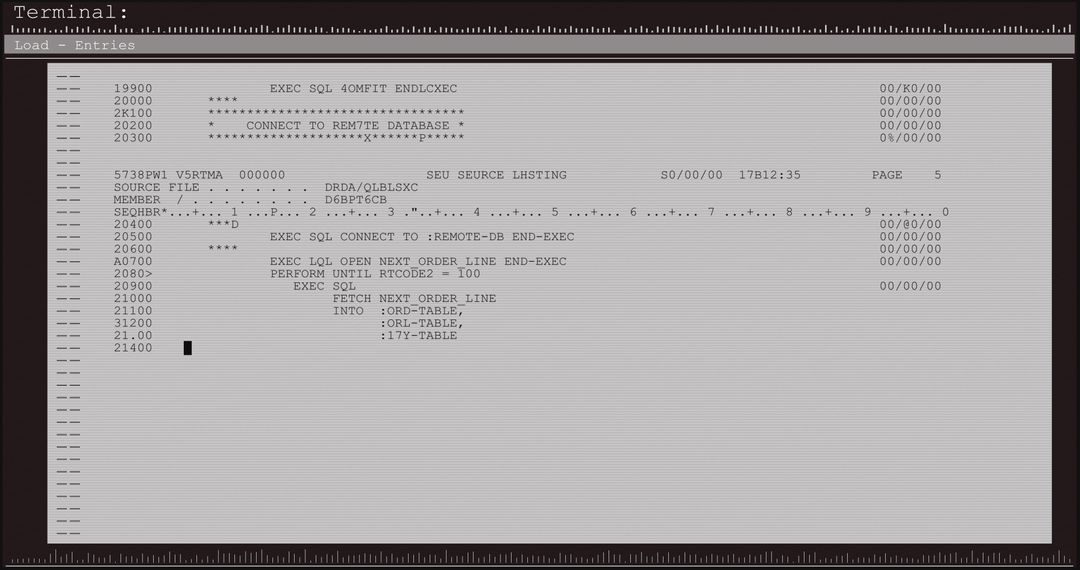
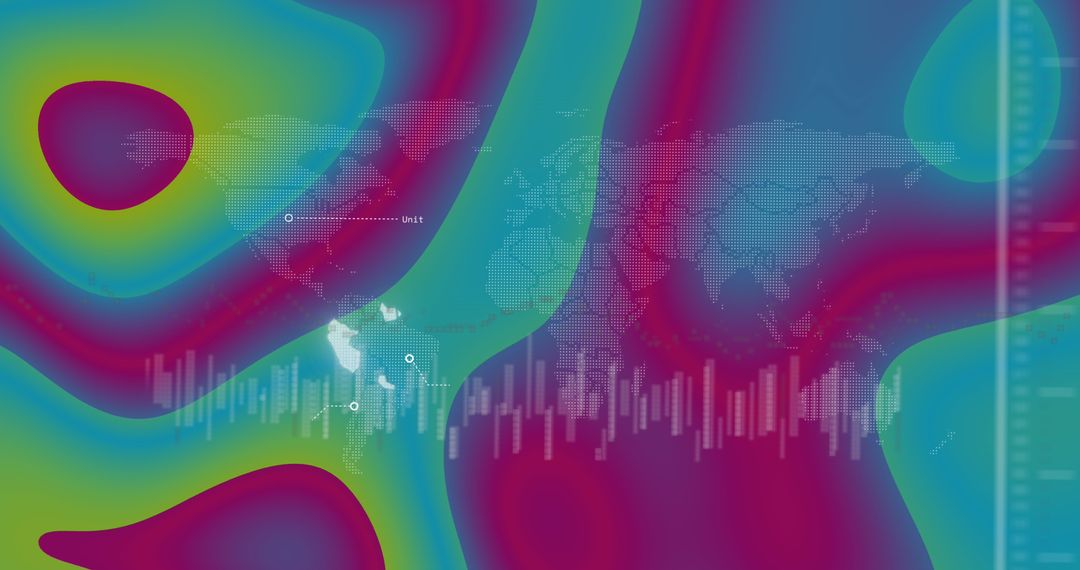
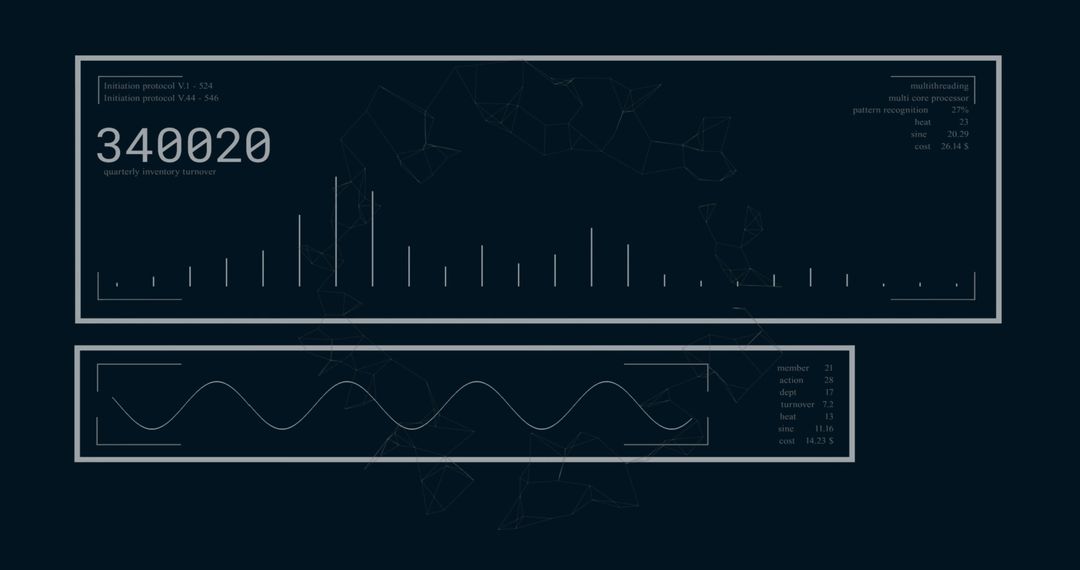
- Digital Display of Stock Market Data and Modern Analytics
Digital Display of Stock Market Data and Modern Analytics Image

Ideal for depicting modern finance and global markets. Whether you need material for financial analytics platforms, investment seminars, or tech-driven digital content, this provides a visually engaging representation. Useful in presentations and designs featuring economic data visualization in the tech and finance sectors.
Powered by 


2
downloads
downloads
Tags:
More
Credit Photo
If you would like to credit the Photo, here are some ways you can do so
Text Link
photo Link
<span class="text-link">
<span>
<a target="_blank" href=https://pikwizard.com/photo/digital-display-of-stock-market-data-and-modern-analytics/30bc8dee611e620e9f8ab2385df4c5ef/>PikWizard</a>
</span>
</span>
<span class="image-link">
<span
style="margin: 0 0 20px 0; display: inline-block; vertical-align: middle; width: 100%;"
>
<a
target="_blank"
href="https://pikwizard.com/photo/digital-display-of-stock-market-data-and-modern-analytics/30bc8dee611e620e9f8ab2385df4c5ef/"
style="text-decoration: none; font-size: 10px; margin: 0;"
>
<img src="https://pikwizard.com/pw/medium/30bc8dee611e620e9f8ab2385df4c5ef.jpg" style="margin: 0; width: 100%;" alt="" />
<p style="font-size: 12px; margin: 0;">PikWizard</p>
</a>
</span>
</span>
Free (free of charge)
Free for personal and commercial use.
Author: Creative Art
Similar Free Stock Images

Premium


Premium


Premium


Premium


Premium


Premium


Premium


Premium


Premium


Premium


Premium


Premium


Premium


Premium


Premium


Premium


Premium


Premium


Premium


Premium


Premium


Premium


Premium


Premium