- Home >
- Stock Photos >
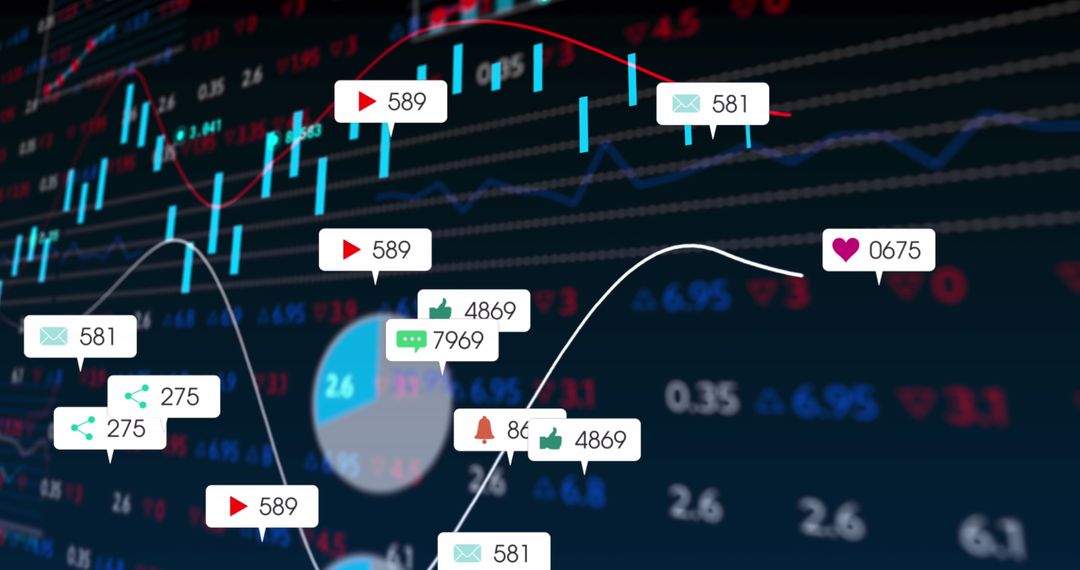
- Digital Display of Stock Market Data with Neon Elements
Digital Display of Stock Market Data with Neon Elements Image

Stock market data intertwined with neon elements offers a futuristic approach to economic analysis. With vivid colors and patterns, this scene appeals to businesses in the financial sector, educational platforms emphasizing modern finance, and design projects looking to incorporate advanced data visualization techniques.
Powered by  - Get 15% off with code: PIKWIZARD15


2
downloads
downloads
Tags:
More
Credit Photo
If you would like to credit the Photo, here are some ways you can do so
Text Link
photo Link
<span class="text-link">
<span>
<a target="_blank" href=https://pikwizard.com/photo/digital-display-of-stock-market-data-with-neon-elements/8d646e9275775d663852daccaca87a87/>PikWizard</a>
</span>
</span>
<span class="image-link">
<span
style="margin: 0 0 20px 0; display: inline-block; vertical-align: middle; width: 100%;"
>
<a
target="_blank"
href="https://pikwizard.com/photo/digital-display-of-stock-market-data-with-neon-elements/8d646e9275775d663852daccaca87a87/"
style="text-decoration: none; font-size: 10px; margin: 0;"
>
<img src="https://pikwizard.com/pw/medium/8d646e9275775d663852daccaca87a87.jpg" style="margin: 0; width: 100%;" alt="" />
<p style="font-size: 12px; margin: 0;">PikWizard</p>
</a>
</span>
</span>
Free (free of charge)
Free for personal and commercial use.
Author: Creative Art
Similar Free Stock Images