- Home >
- Stock Photos >
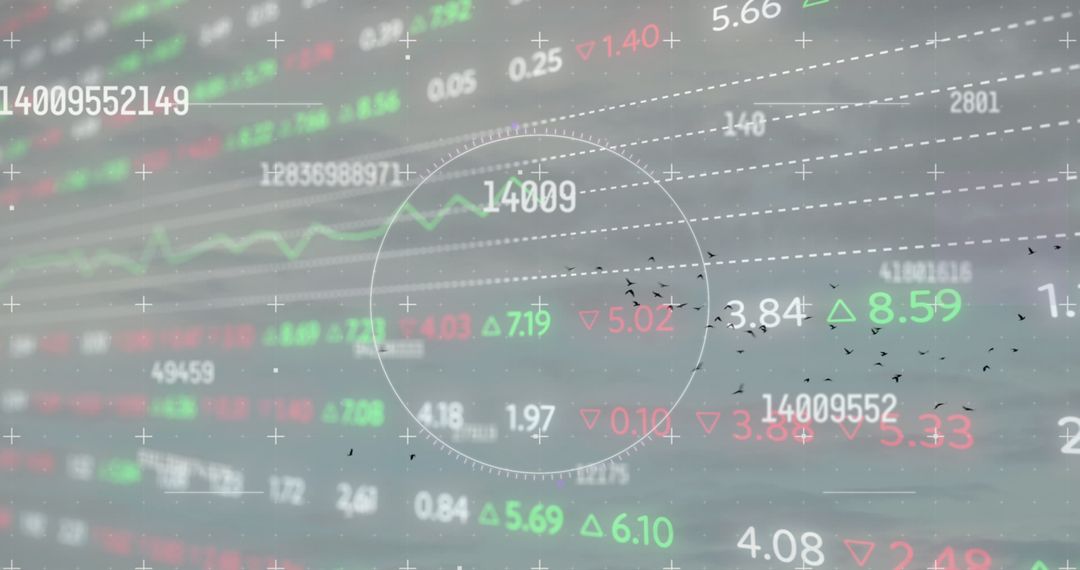
- Digital Display of Stock Market Graph and Data with Interface
Digital Display of Stock Market Graph and Data with Interface Image

Digital overlay shows fluctuating stock data and graphs. Modern scanning icons indicate technological analysis and data security aspect. Useful for illustrating financial growth, technological trends in markets, and digital economy. Ideal for websites or articles on stock trading, financial technology, or business innovation.
Powered by 


4
downloads
downloads
Tags:
More
Credit Photo
If you would like to credit the Photo, here are some ways you can do so
Text Link
photo Link
<span class="text-link">
<span>
<a target="_blank" href=https://pikwizard.com/photo/digital-display-of-stock-market-graph-and-data-with-interface/043be1d172ef0ea758664d8a86ec62e6/>PikWizard</a>
</span>
</span>
<span class="image-link">
<span
style="margin: 0 0 20px 0; display: inline-block; vertical-align: middle; width: 100%;"
>
<a
target="_blank"
href="https://pikwizard.com/photo/digital-display-of-stock-market-graph-and-data-with-interface/043be1d172ef0ea758664d8a86ec62e6/"
style="text-decoration: none; font-size: 10px; margin: 0;"
>
<img src="https://pikwizard.com/pw/medium/043be1d172ef0ea758664d8a86ec62e6.jpg" style="margin: 0; width: 100%;" alt="" />
<p style="font-size: 12px; margin: 0;">PikWizard</p>
</a>
</span>
</span>
Free (free of charge)
Free for personal and commercial use.
Author: Awesome Content
Similar Free Stock Images

Premium


Premium


Premium


Premium


Premium


Premium


Premium


Premium


Premium


Premium


Premium


Premium


Premium


Premium


Premium


Premium


Premium


Premium


Premium


Premium


Premium


Premium


Premium


Premium