- Home >
- Stock Photos >
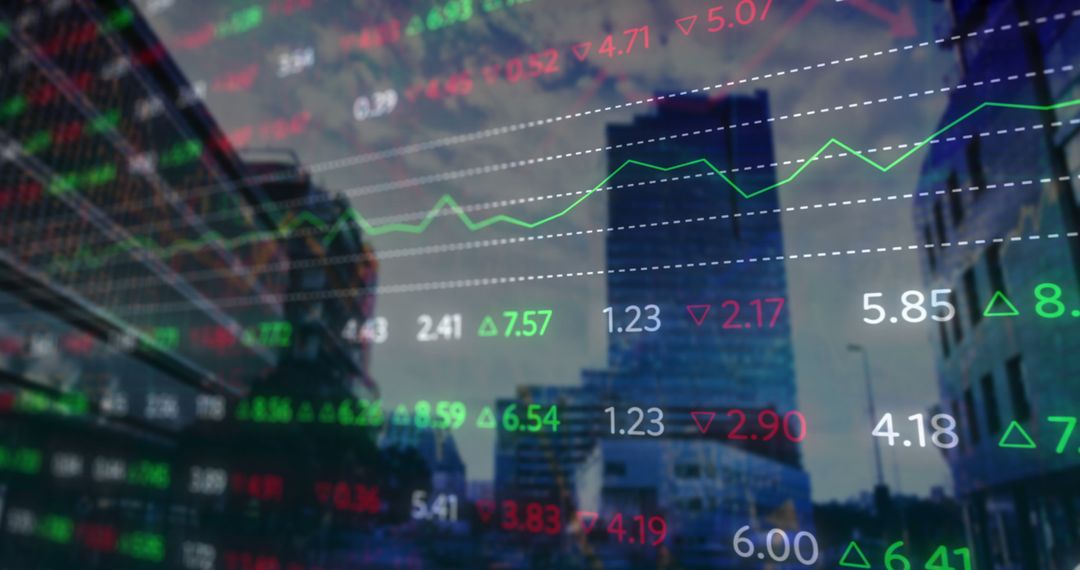
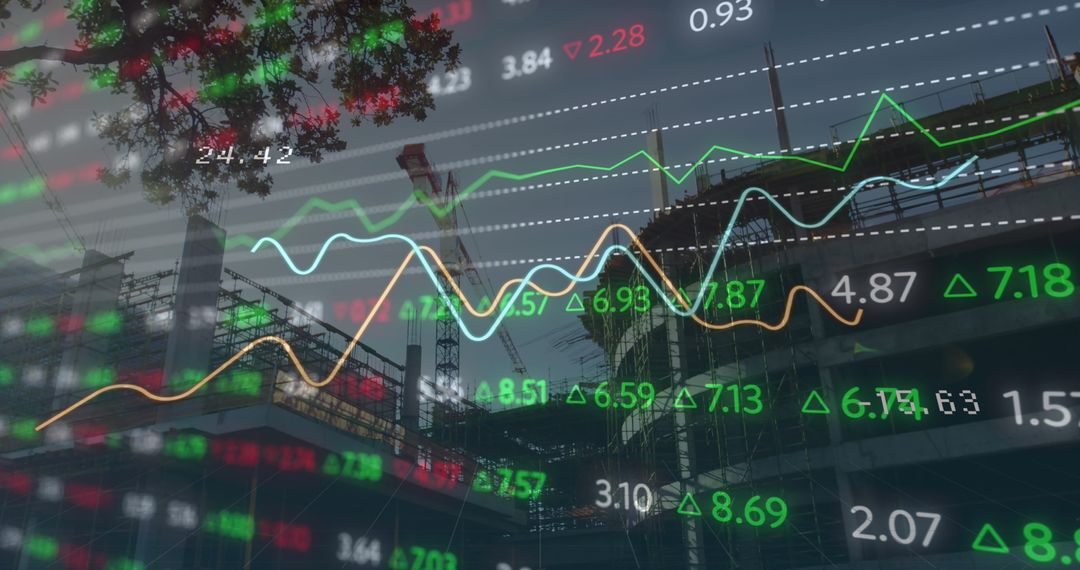
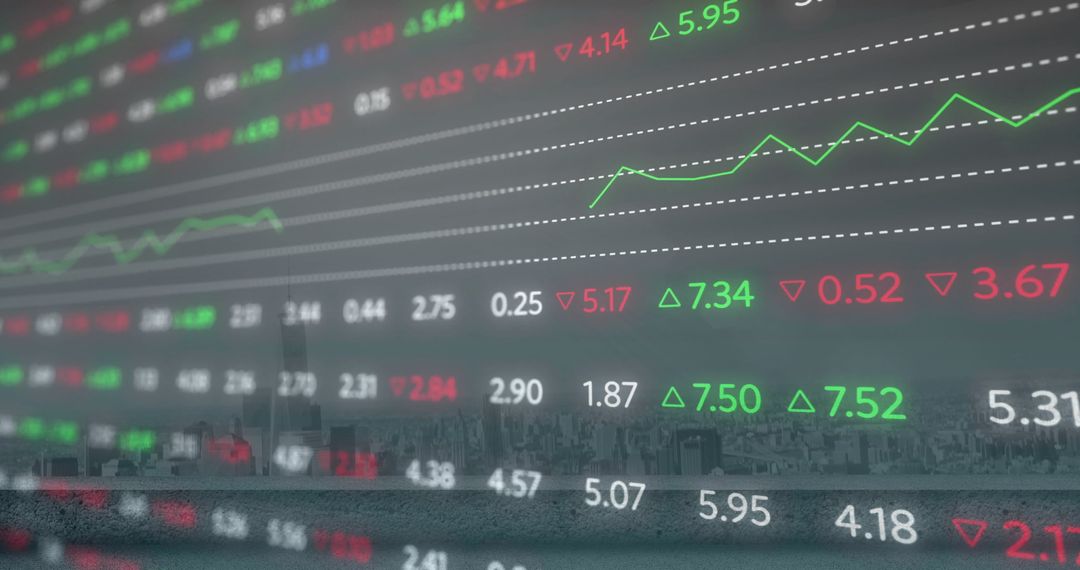
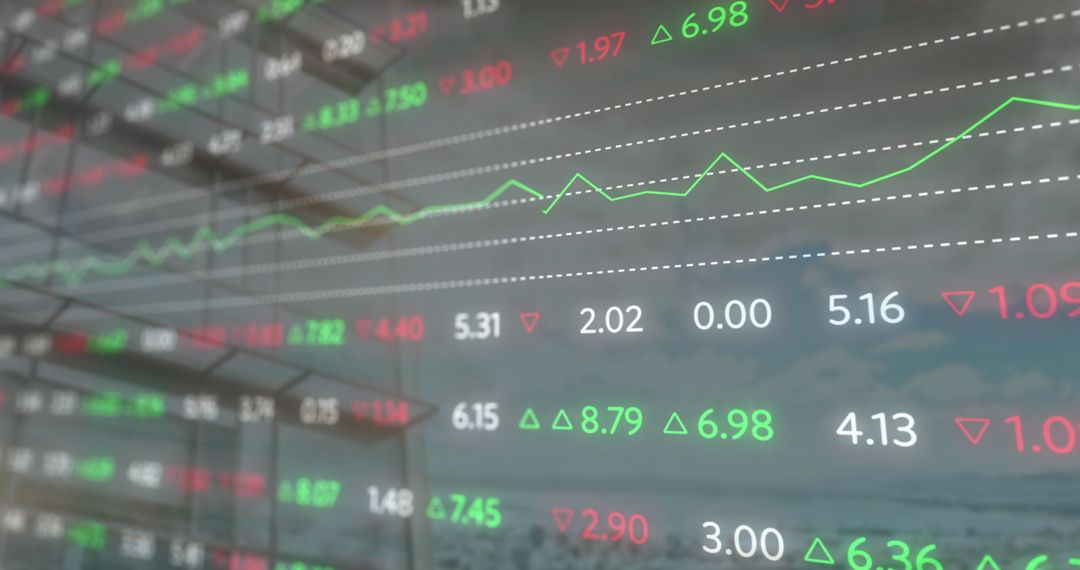
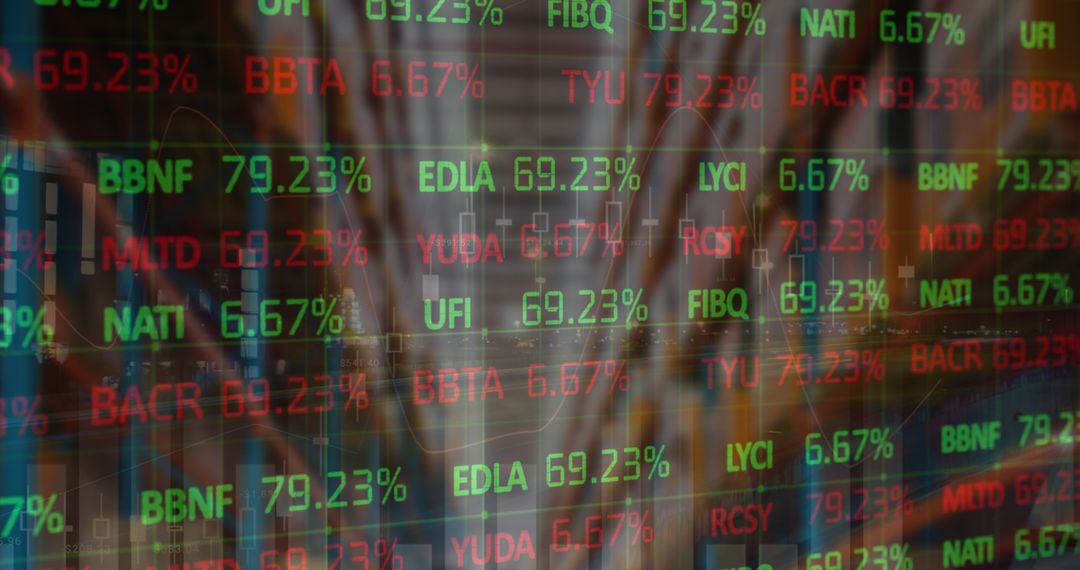
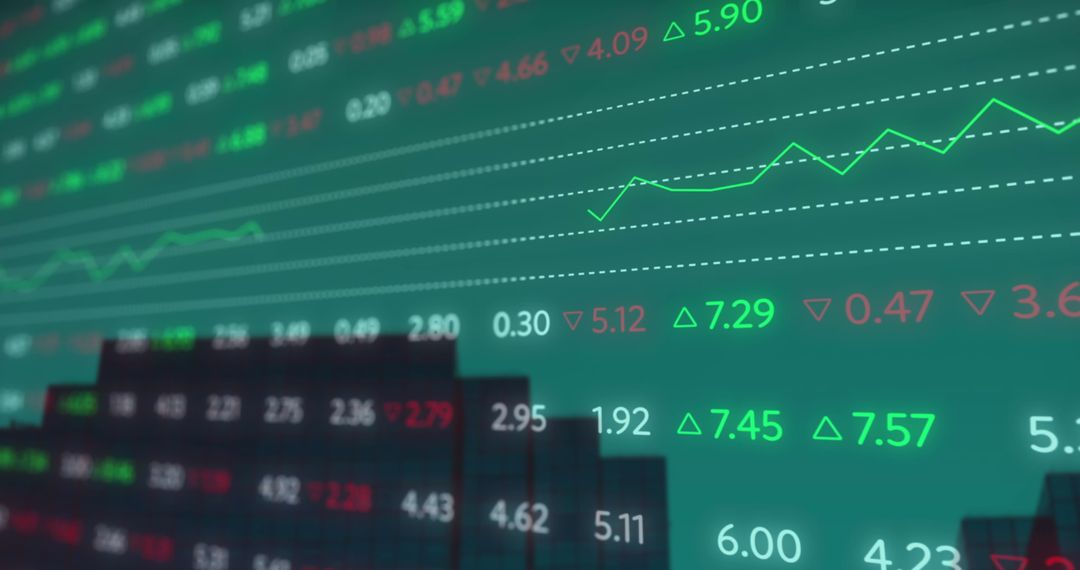
- Digital Display of Stock Market Trends with Graphs and Numbers
Digital Display of Stock Market Trends with Graphs and Numbers Image

This visual presents fluctuating graphs and numbers on a digital screen, depicting real-time stock market trends. The overlay of numbers and green rising lines conveys the dynamic nature of finance and investment scenarios. This could be used in articles, blogs, or presentations about stock trading, financial analytics, market forecasts, and economic studies. Ideal for those who wish to illustrate volatility and movements in finance sectors.
Powered by 


2
downloads
downloads
Tags:
More
Credit Photo
If you would like to credit the Photo, here are some ways you can do so
Text Link
photo Link
<span class="text-link">
<span>
<a target="_blank" href=https://pikwizard.com/photo/digital-display-of-stock-market-trends-with-graphs-and-numbers/65aaed122bac64a67d8e8629bf29dc26/>PikWizard</a>
</span>
</span>
<span class="image-link">
<span
style="margin: 0 0 20px 0; display: inline-block; vertical-align: middle; width: 100%;"
>
<a
target="_blank"
href="https://pikwizard.com/photo/digital-display-of-stock-market-trends-with-graphs-and-numbers/65aaed122bac64a67d8e8629bf29dc26/"
style="text-decoration: none; font-size: 10px; margin: 0;"
>
<img src="https://pikwizard.com/pw/medium/65aaed122bac64a67d8e8629bf29dc26.jpg" style="margin: 0; width: 100%;" alt="" />
<p style="font-size: 12px; margin: 0;">PikWizard</p>
</a>
</span>
</span>
Free (free of charge)
Free for personal and commercial use.
Author: Creative Art
Similar Free Stock Images

Premium


Premium


Premium


Premium


Premium


Premium


Premium


Premium


Premium


Premium


Premium


Premium


Premium


Premium


Premium


Premium


Premium


Premium


Premium


Premium


Premium


Premium


Premium


Premium