
- Home >
- Stock Photos >
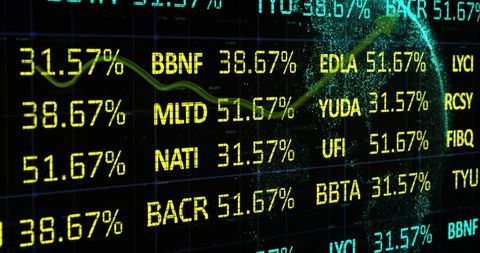
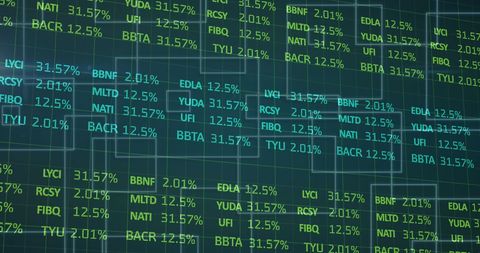
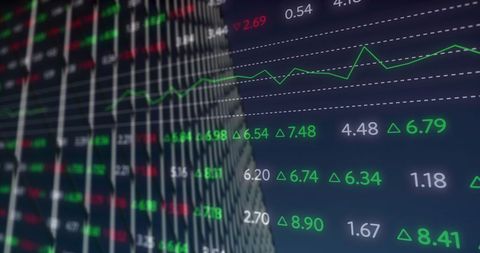
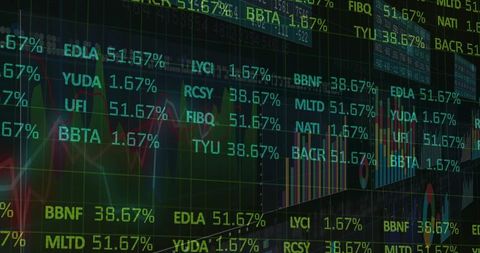
- Digital Display of Trading Data with Graphs and Figures
Digital Display of Trading Data with Graphs and Figures Image

Displays financial data and stock market values accompanied by graphs, ideal for content related to business and economic forecasting. Suitable for finance investments visualizations and corporate technology presentations.
Powered by  - Get 15% off with code: PIKWIZARD15


downloads
Tags:
More
Credit Photo
If you would like to credit the Photo, here are some ways you can do so
Text Link
photo Link
<span class="text-link">
<span>
<a target="_blank" href=https://pikwizard.com/photo/digital-display-of-trading-data-with-graphs-and-figures/2ff0ed1e6e68b75cb78679a12484f519/>PikWizard</a>
</span>
</span>
<span class="image-link">
<span
style="margin: 0 0 20px 0; display: inline-block; vertical-align: middle; width: 100%;"
>
<a
target="_blank"
href="https://pikwizard.com/photo/digital-display-of-trading-data-with-graphs-and-figures/2ff0ed1e6e68b75cb78679a12484f519/"
style="text-decoration: none; font-size: 10px; margin: 0;"
>
<img src="https://pikwizard.com/pw/medium/2ff0ed1e6e68b75cb78679a12484f519.jpg" style="margin: 0; width: 100%;" alt="" />
<p style="font-size: 12px; margin: 0;">PikWizard</p>
</a>
</span>
</span>
Free (free of charge)
Free for personal and commercial use.
Author: Awesome Content
Similar Free Stock Images
Loading...

Premium


Premium


Premium


Premium


Premium


Premium

Premium


Premium


Premium

Premium


Premium

Premium


Premium

Premium


Premium


Premium

Premium

Premium


Premium

Premium


Premium


Premium

Premium

Premium

Premium


Explore More Free Stock Images