- Home >
- Stock Photos >
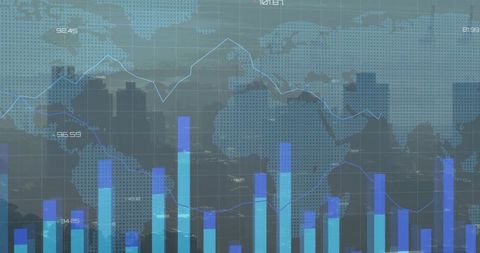
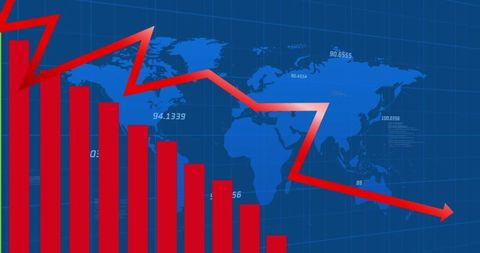
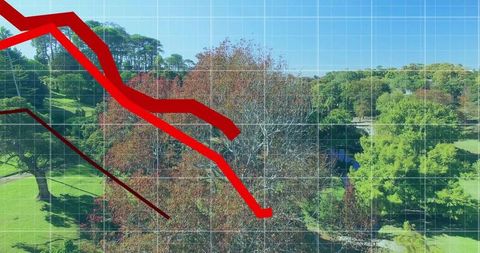
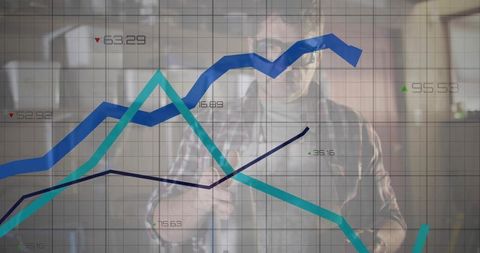
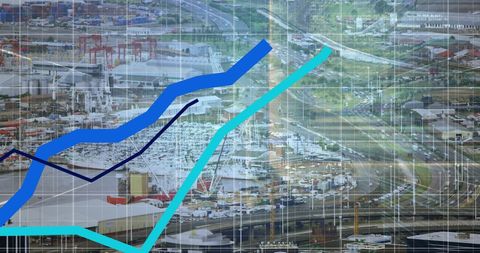
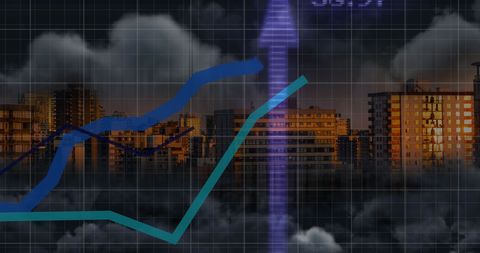
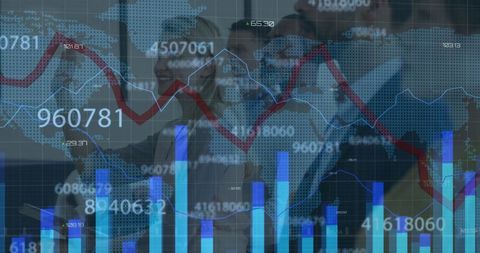
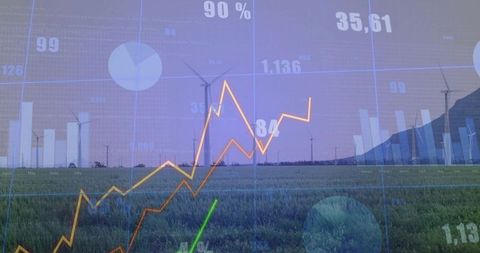
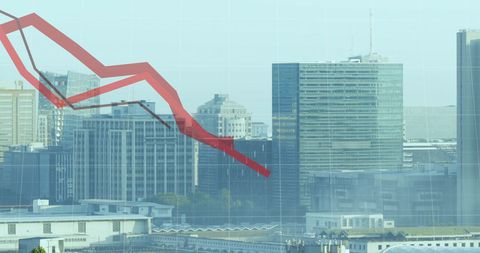
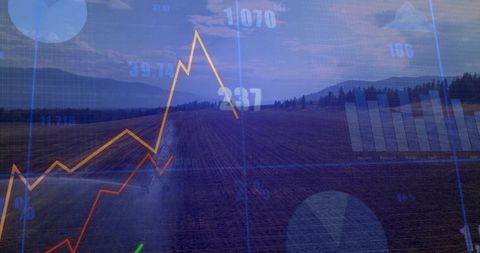
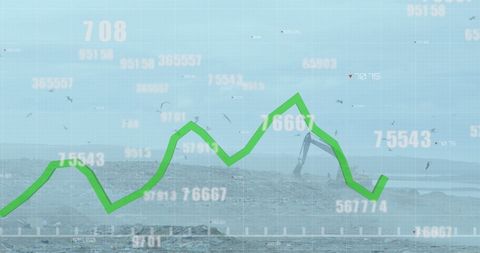
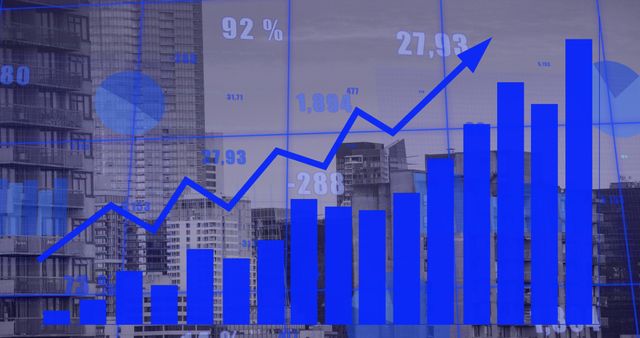
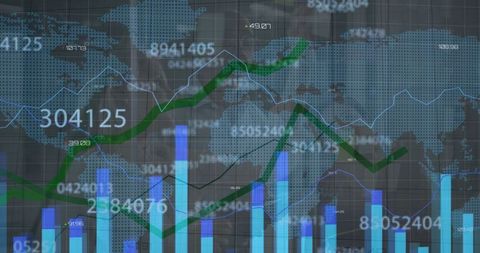
- Digital Economic Growth with Graphs and People Icons
Digital Economic Growth with Graphs and People Icons Image

Abstract design features digital representations of financial growth blended with triangular patterns and icons symbolizing networked individuals. Suitable for presentations or articles on economic forecasting, digital transformation in finance, networking, and technology advancements offering insights into market analytics and group network structures.
Powered by 


downloads
Tags:
More
Credit Photo
If you would like to credit the Photo, here are some ways you can do so
Text Link
photo Link
<span class="text-link">
<span>
<a target="_blank" href=https://pikwizard.com/photo/digital-economic-growth-with-graphs-and-people-icons/e89ed7ea9dda00d0206505565f1c3dcf/>PikWizard</a>
</span>
</span>
<span class="image-link">
<span
style="margin: 0 0 20px 0; display: inline-block; vertical-align: middle; width: 100%;"
>
<a
target="_blank"
href="https://pikwizard.com/photo/digital-economic-growth-with-graphs-and-people-icons/e89ed7ea9dda00d0206505565f1c3dcf/"
style="text-decoration: none; font-size: 10px; margin: 0;"
>
<img src="https://pikwizard.com/pw/medium/e89ed7ea9dda00d0206505565f1c3dcf.jpg" style="margin: 0; width: 100%;" alt="" />
<p style="font-size: 12px; margin: 0;">PikWizard</p>
</a>
</span>
</span>
Free (free of charge)
Free for personal and commercial use.
Author: People Creations
Similar Free Stock Images
Loading...

Premium


Premium


Premium

Premium


Premium


Premium

Premium


Premium

Premium

Premium

Premium


Premium

Premium


Premium


Premium


Premium

Premium


Premium

Premium


Premium


Premium


Premium

Premium


Premium


Premium