- Home >
- Stock Photos >
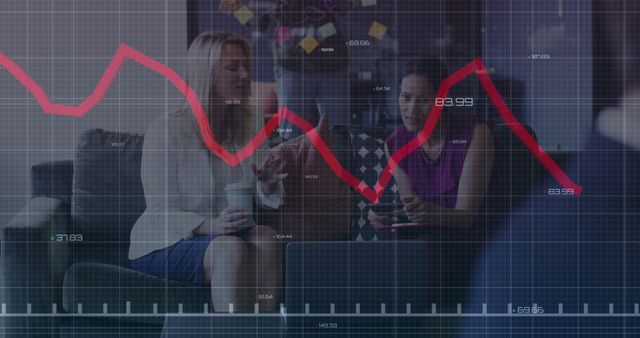
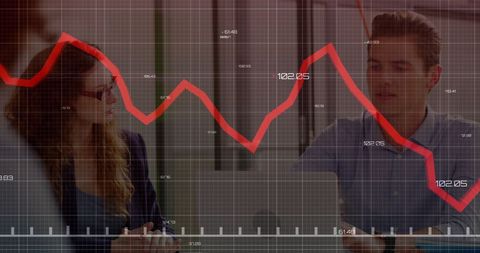
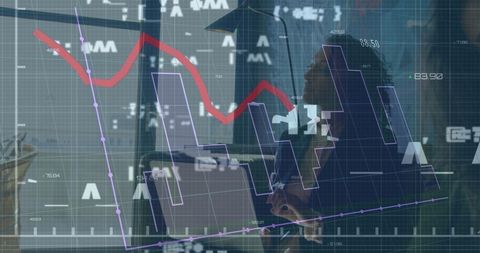
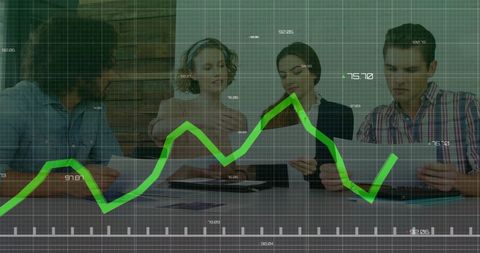
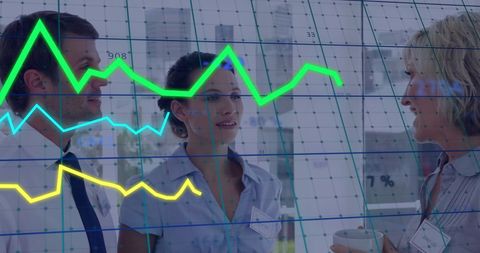
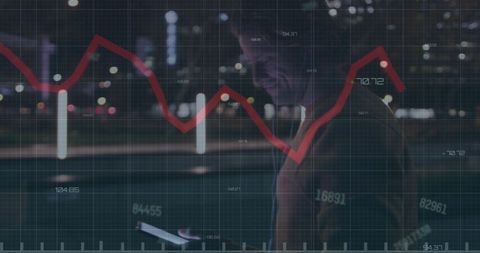
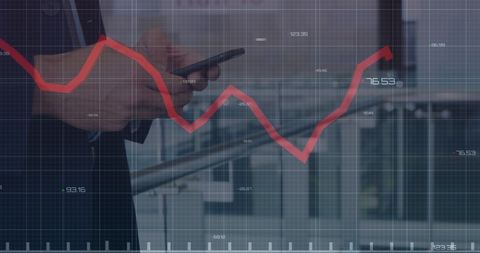
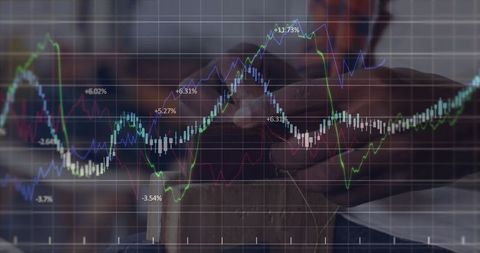
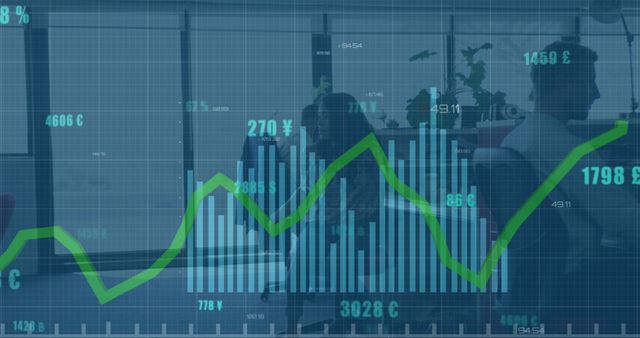
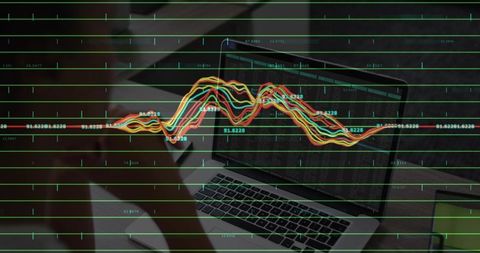
- Digital Economic Impact Visualization with Declining Trends
Digital Economic Impact Visualization with Declining Trends Image

Depicts graphs and negative trends overlaid with economic-related terms showcasing financial conditions. Useful for illustrating articles or presentations on economic downturn, market analysis, and financial strategies.

downloads
Tags:
More
Credit Photo
If you would like to credit the Photo, here are some ways you can do so
Text Link
photo Link
<span class="text-link">
<span>
<a target="_blank" href=https://pikwizard.com/photo/digital-economic-impact-visualization-with-declining-trends/b34f0390b9183ab4a2ed1f23c5110e4a/>PikWizard</a>
</span>
</span>
<span class="image-link">
<span
style="margin: 0 0 20px 0; display: inline-block; vertical-align: middle; width: 100%;"
>
<a
target="_blank"
href="https://pikwizard.com/photo/digital-economic-impact-visualization-with-declining-trends/b34f0390b9183ab4a2ed1f23c5110e4a/"
style="text-decoration: none; font-size: 10px; margin: 0;"
>
<img src="https://pikwizard.com/pw/medium/b34f0390b9183ab4a2ed1f23c5110e4a.jpg" style="margin: 0; width: 100%;" alt="" />
<p style="font-size: 12px; margin: 0;">PikWizard</p>
</a>
</span>
</span>
Free (free of charge)
Free for personal and commercial use.
Author: People Creations