- Home >
- Stock Photos >
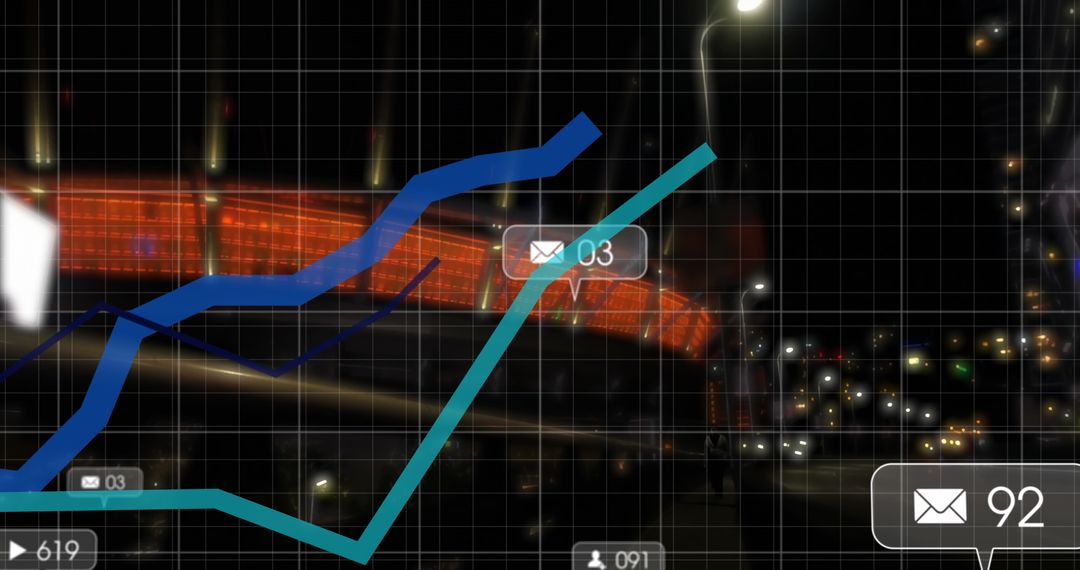
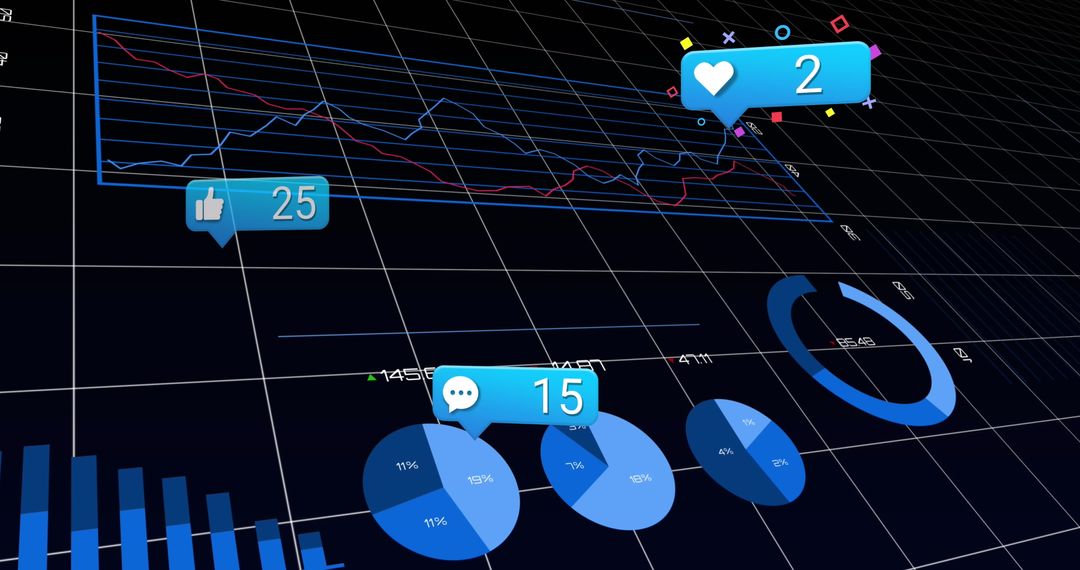
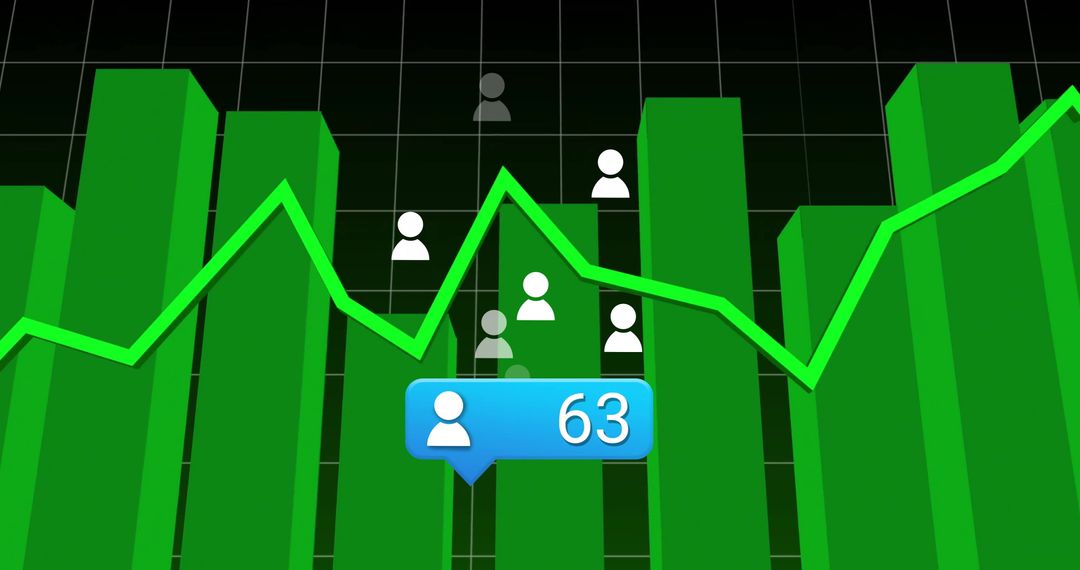
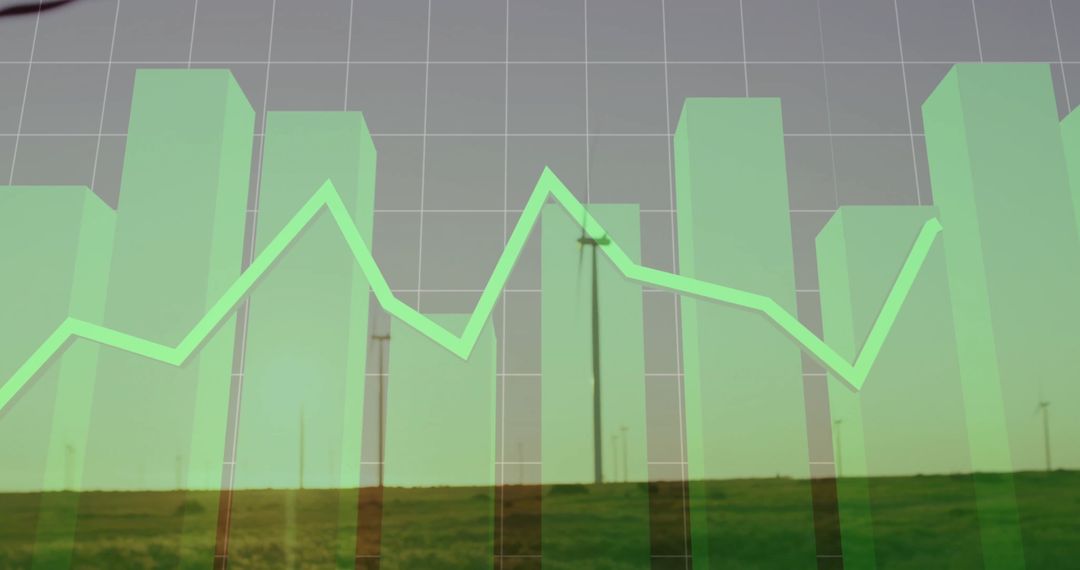
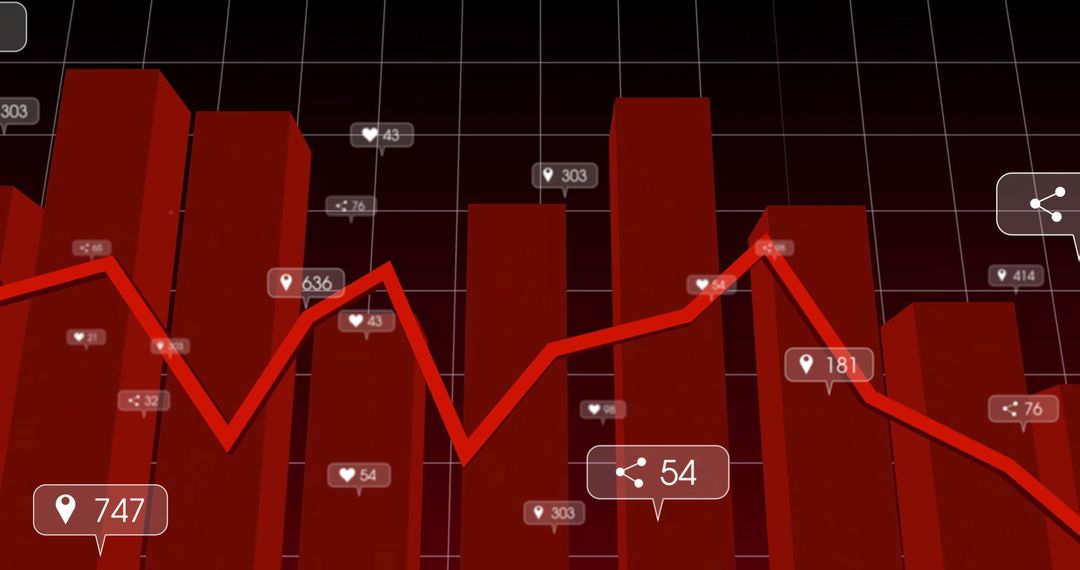
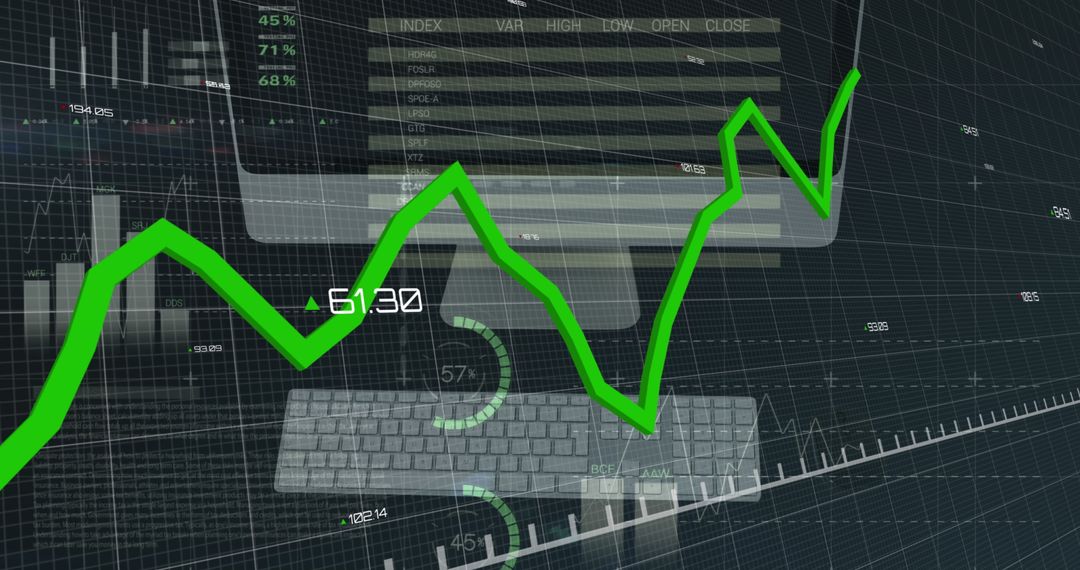
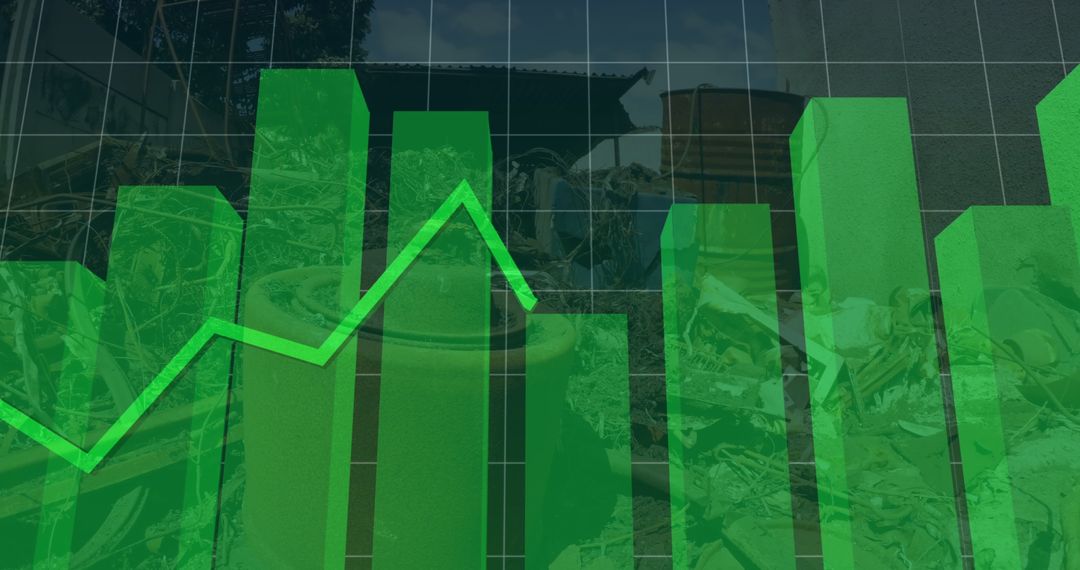
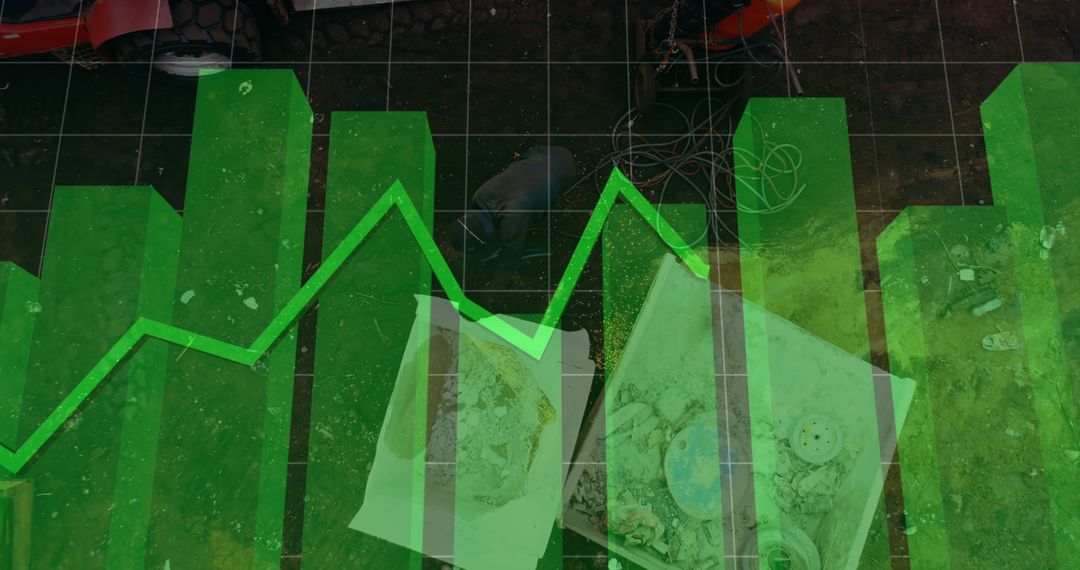
- Digital Engagement Analytics with Dynamic Bar and Line Graph
Digital Engagement Analytics with Dynamic Bar and Line Graph Image
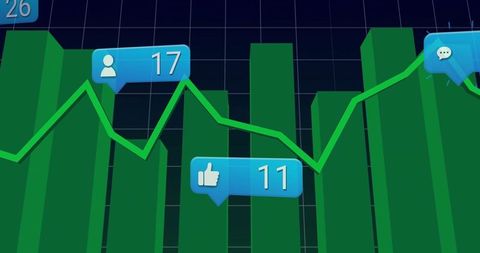
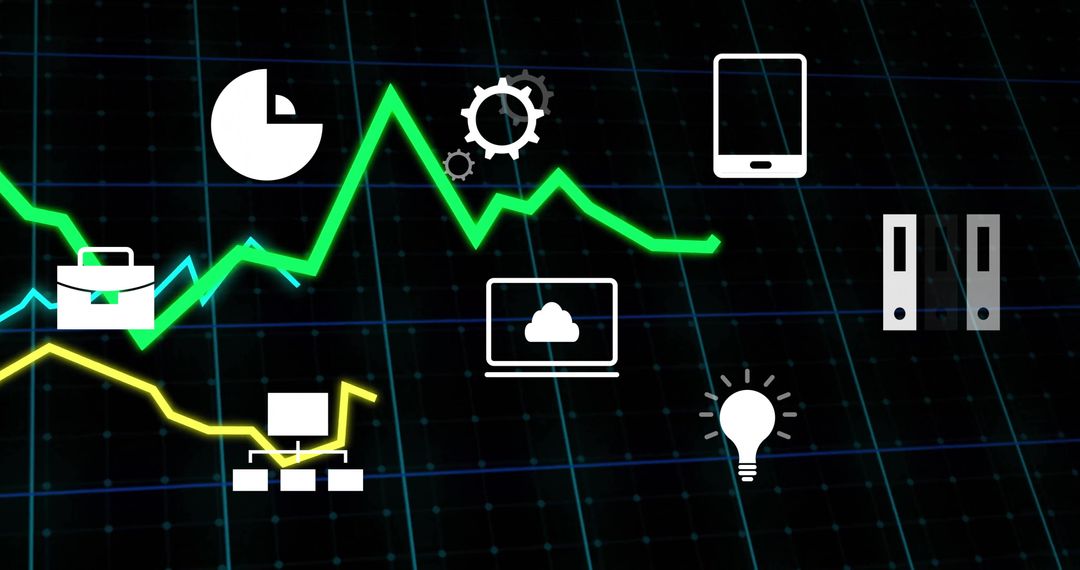
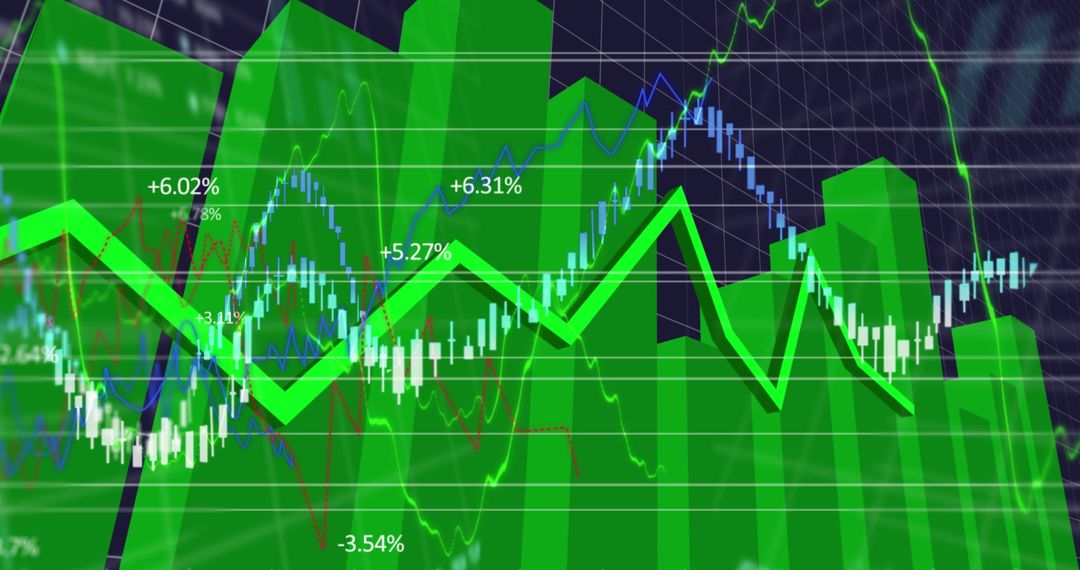
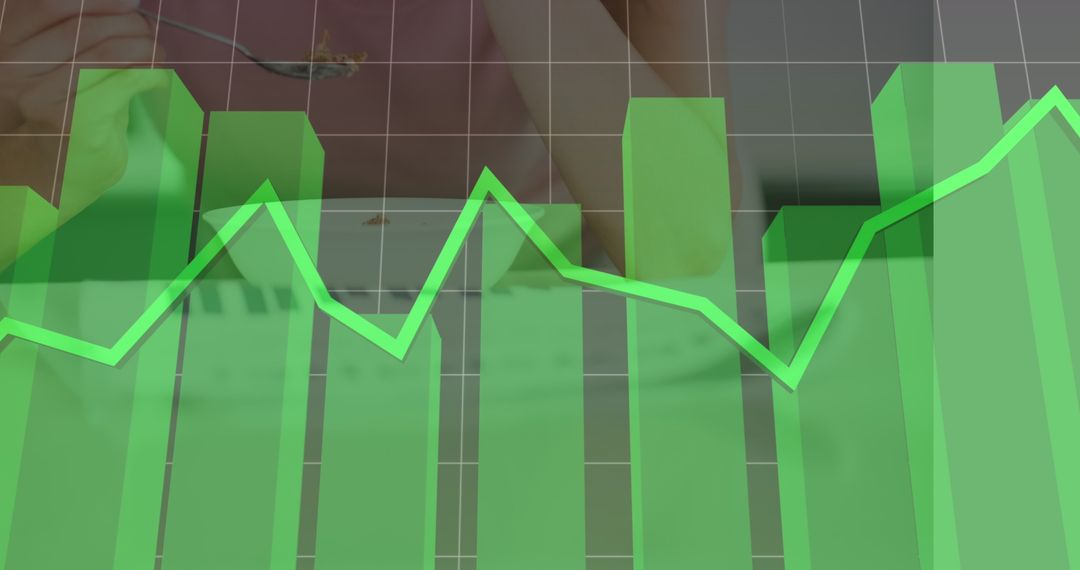
Dynamic illustration of digital analytics showing growth in user engagement. Features include neon-colored bar and line charts with social media icons showing insights. Suitable for use in business presentations, portfolio case studies, infographics on marketing strategies and online user behavior insights.
Powered by 


0
downloads
downloads
Tags:
More
Credit Photo
If you would like to credit the Photo, here are some ways you can do so
Text Link
photo Link
<span class="text-link">
<span>
<a target="_blank" href=https://pikwizard.com/photo/digital-engagement-analytics-with-dynamic-bar-and-line-graph/5b374df1238dab5818e4c316281ffeaa/>PikWizard</a>
</span>
</span>
<span class="image-link">
<span
style="margin: 0 0 20px 0; display: inline-block; vertical-align: middle; width: 100%;"
>
<a
target="_blank"
href="https://pikwizard.com/photo/digital-engagement-analytics-with-dynamic-bar-and-line-graph/5b374df1238dab5818e4c316281ffeaa/"
style="text-decoration: none; font-size: 10px; margin: 0;"
>
<img src="https://pikwizard.com/pw/medium/5b374df1238dab5818e4c316281ffeaa.jpg" style="margin: 0; width: 100%;" alt="" />
<p style="font-size: 12px; margin: 0;">PikWizard</p>
</a>
</span>
</span>
Free (free of charge)
Free for personal and commercial use.
Author: Awesome Content
Similar Free Stock Images

Premium

Premium


Premium


Premium


Premium


Premium


Premium


Premium


Premium


Premium


Premium


Premium


Premium


Premium


Premium


Premium


Premium


Premium


Premium


Premium


Premium


Premium


Premium


Premium