
- Home >
- Stock Photos >
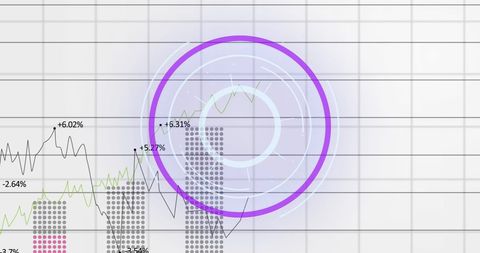
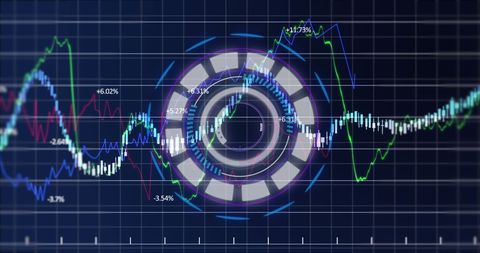
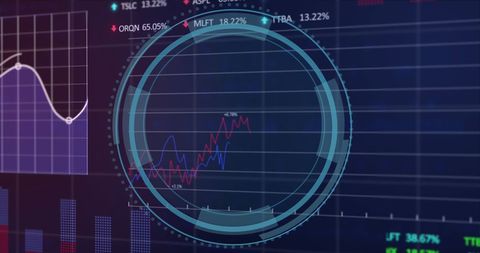
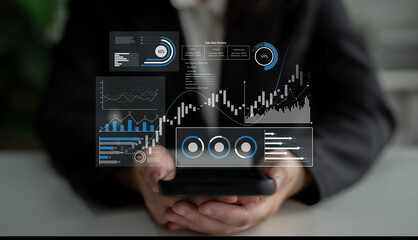
- Digital Finance Analysis: Interactive Data Visualization on Screen
Digital Finance Analysis: Interactive Data Visualization on Screen Image

Interactive finance visualization features data and scanner overlays, ideal for illustrating concepts in digital finance and technology-driven global markets. Perfect for engaging presentations and articles related to stock market trends and business analytics.
Powered by 


downloads
Tags:
More
Credit Photo
If you would like to credit the Photo, here are some ways you can do so
Text Link
photo Link
<span class="text-link">
<span>
<a target="_blank" href=https://pikwizard.com/photo/digital-finance-analysis-interactive-data-visualization-on-screen/c3c9f420e44ab6192a40d93798fca81b/>PikWizard</a>
</span>
</span>
<span class="image-link">
<span
style="margin: 0 0 20px 0; display: inline-block; vertical-align: middle; width: 100%;"
>
<a
target="_blank"
href="https://pikwizard.com/photo/digital-finance-analysis-interactive-data-visualization-on-screen/c3c9f420e44ab6192a40d93798fca81b/"
style="text-decoration: none; font-size: 10px; margin: 0;"
>
<img src="https://pikwizard.com/pw/medium/c3c9f420e44ab6192a40d93798fca81b.jpg" style="margin: 0; width: 100%;" alt="" />
<p style="font-size: 12px; margin: 0;">PikWizard</p>
</a>
</span>
</span>
Free (free of charge)
Free for personal and commercial use.
Author: Awesome Content
Similar Free Stock Images
Loading...

Premium


Premium


Premium

Premium


Premium


Premium

Premium

Premium


Premium


Premium


Premium


Premium


Premium


Premium


Premium


Premium

Premium


Premium


Premium

Premium


Premium


Premium


Premium


Premium


Premium
