- Home >
- Stock Photos >
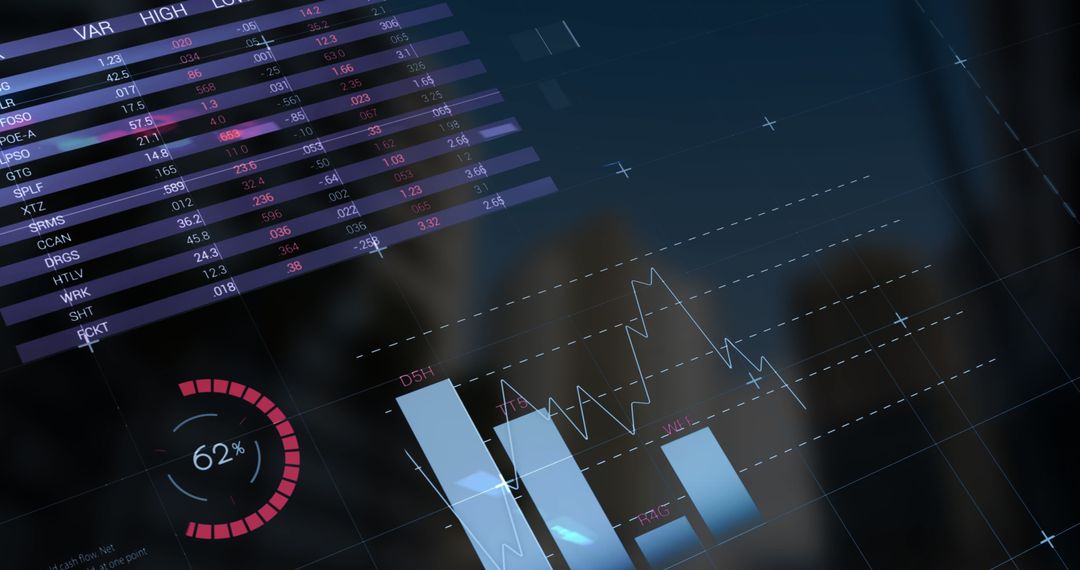
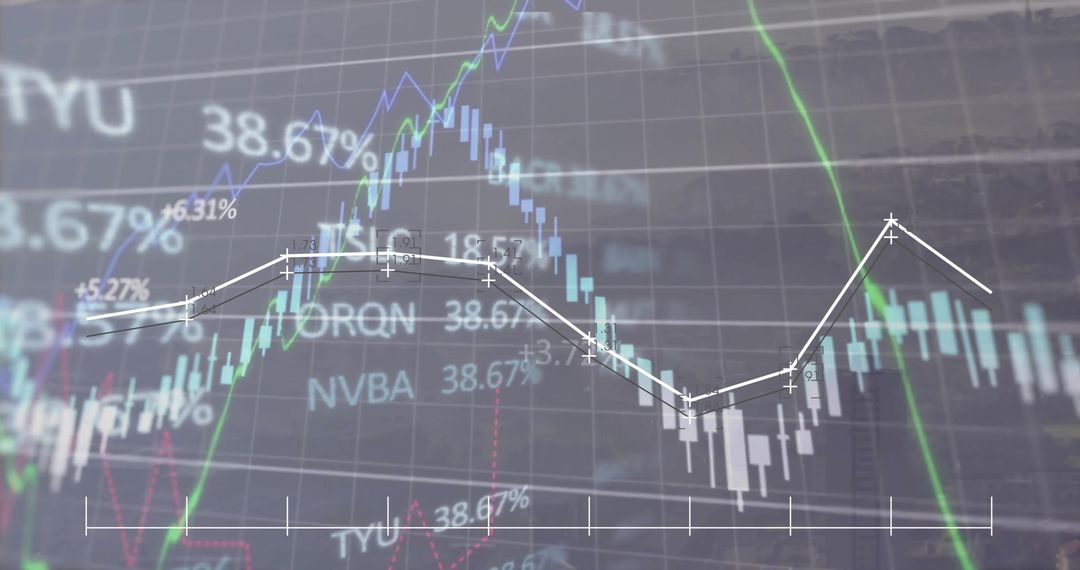
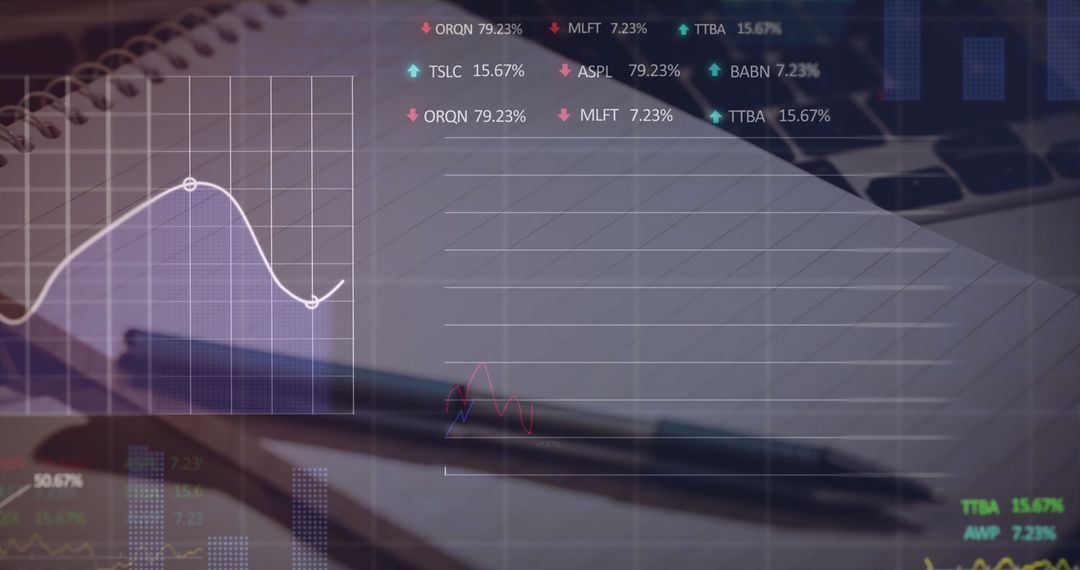
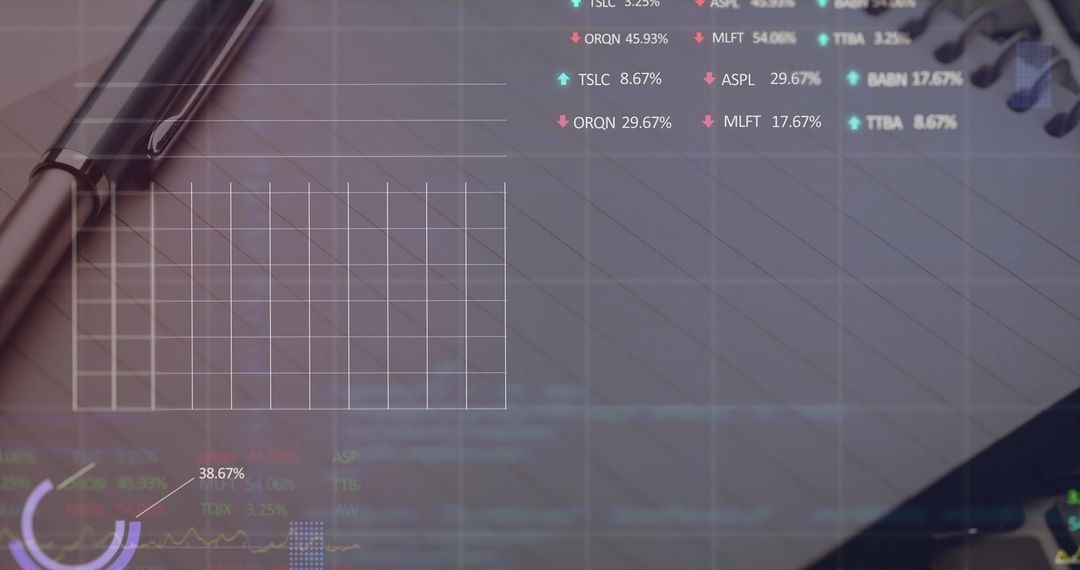
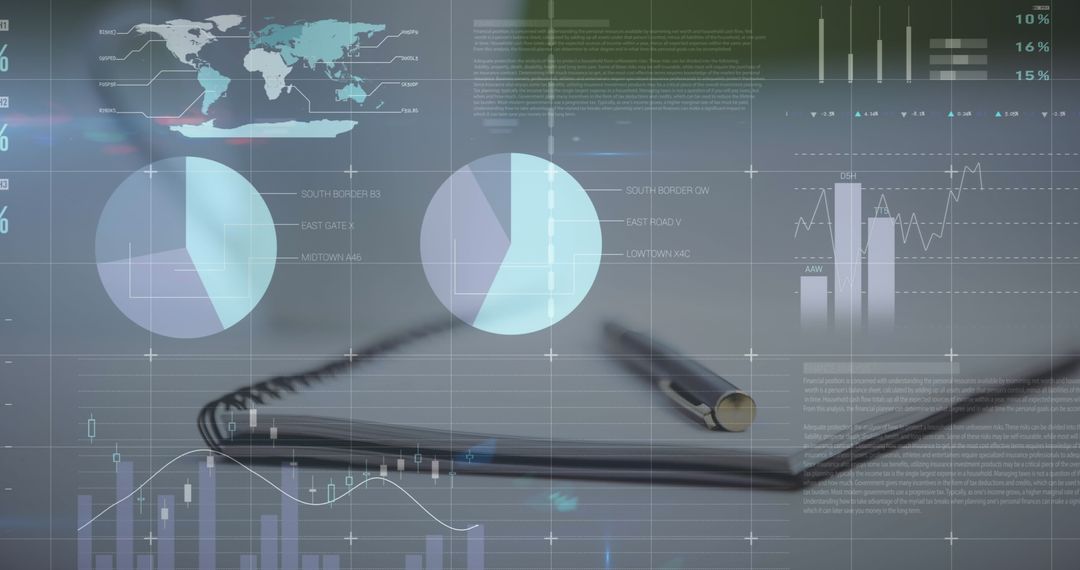
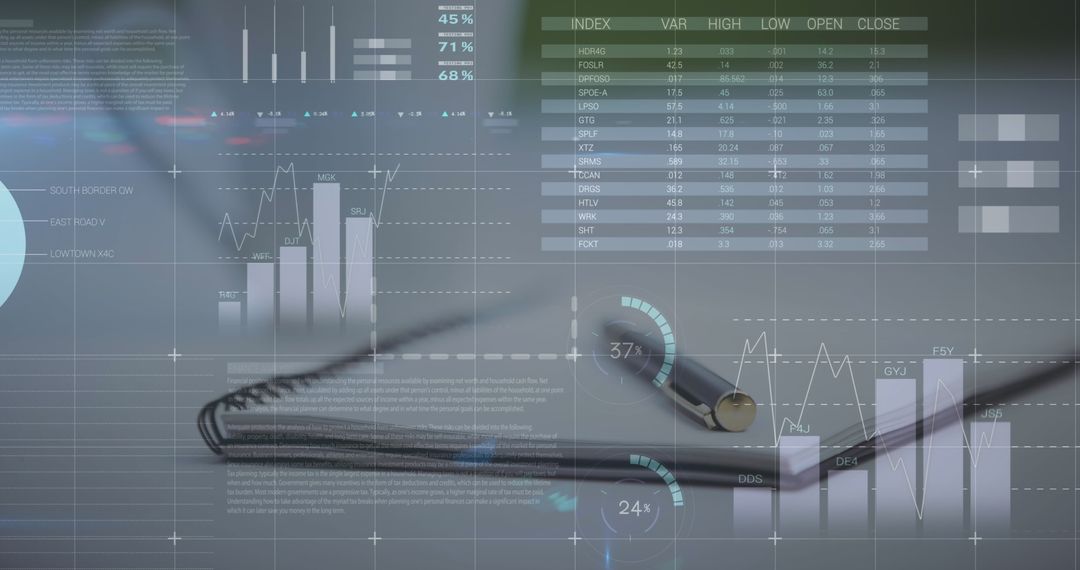
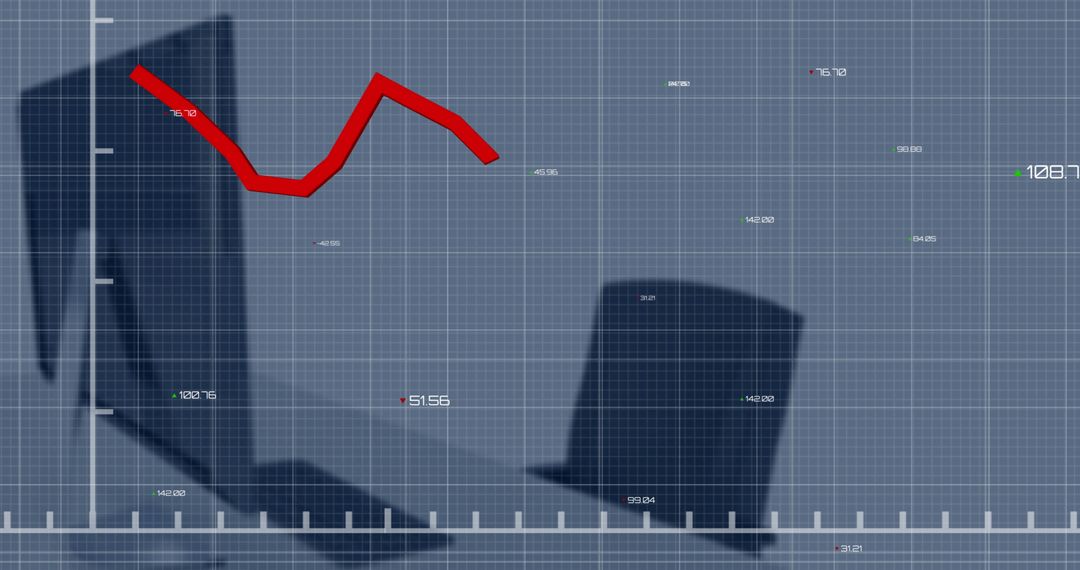
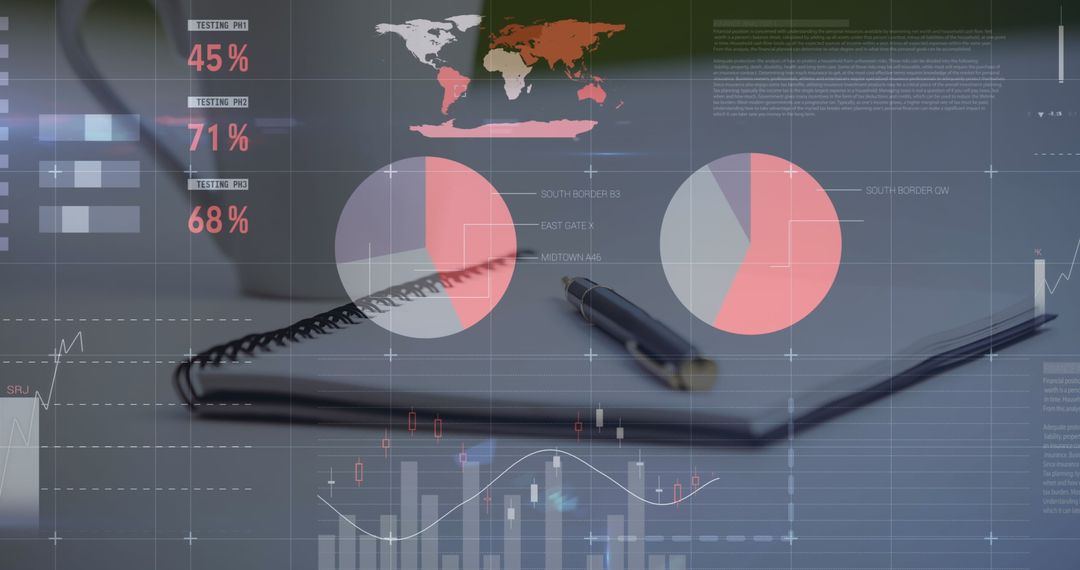
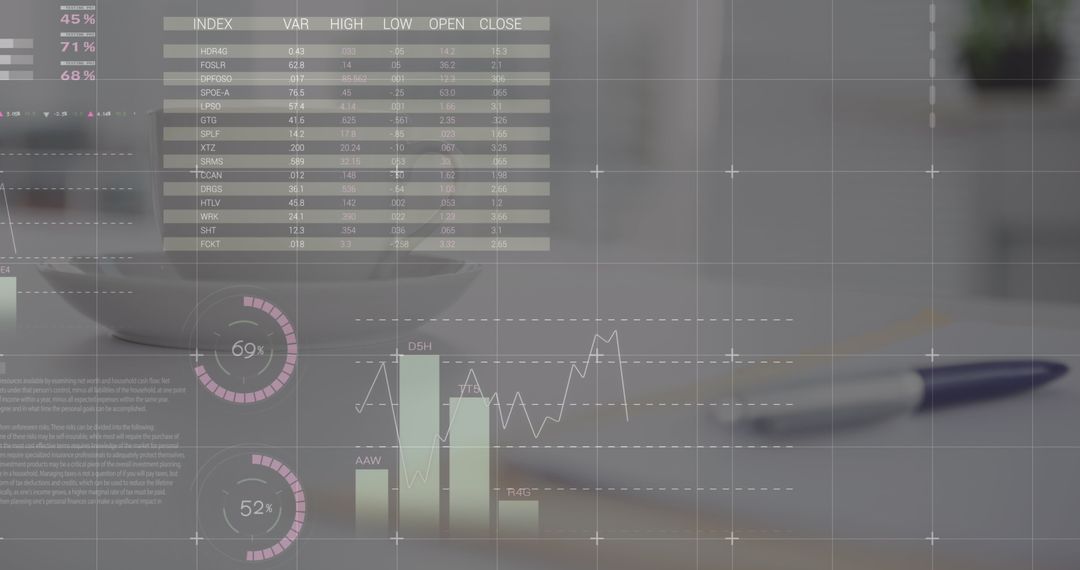
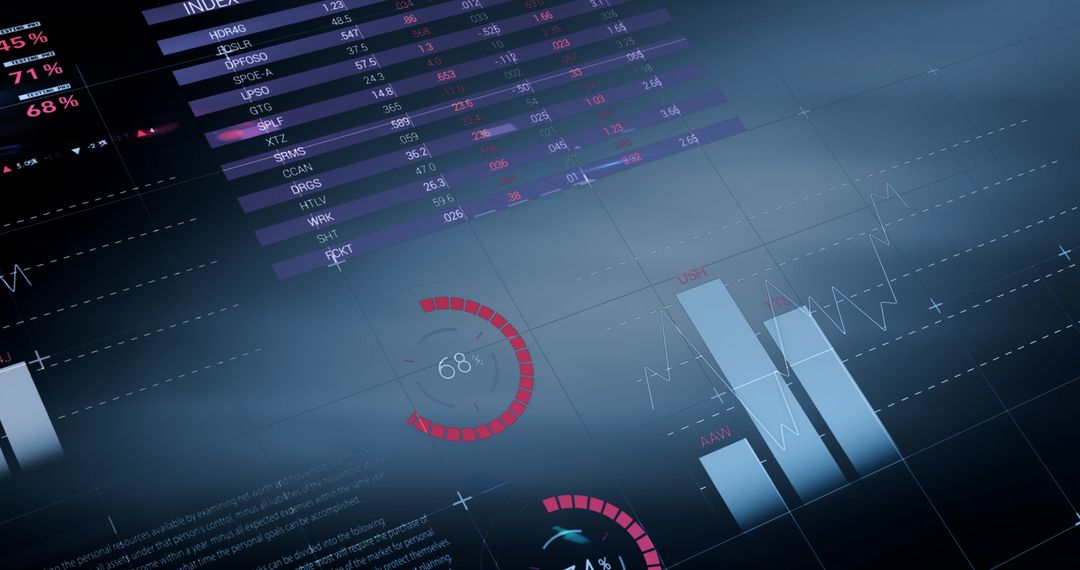
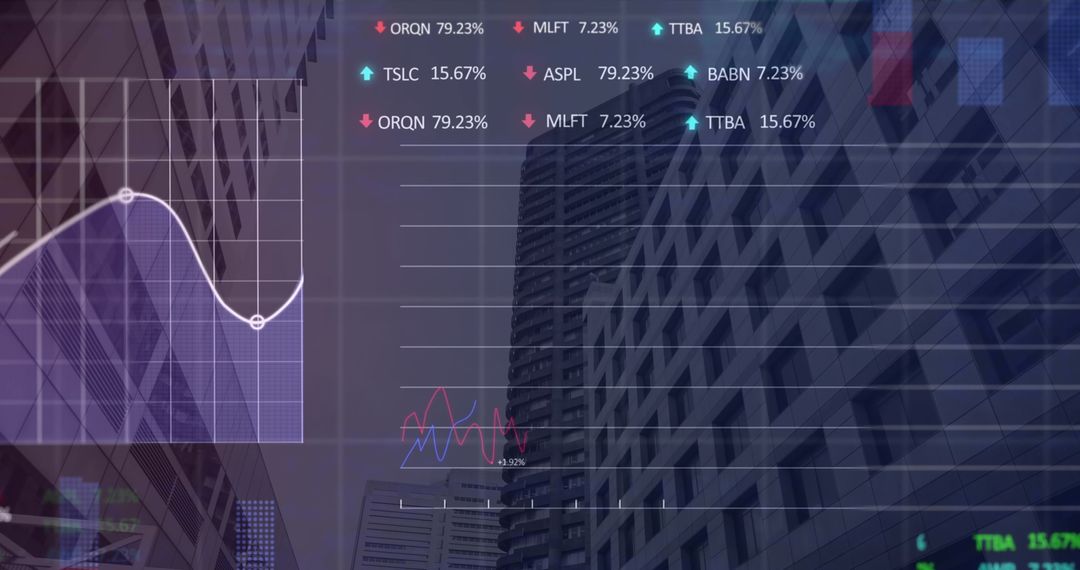
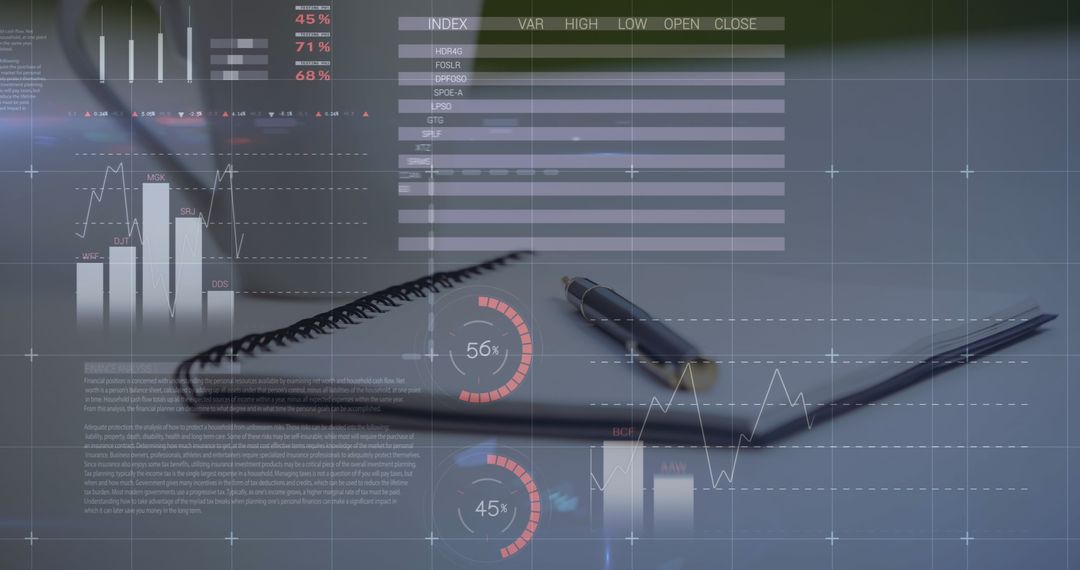
- Digital Finance Analysis with Pen and Notebook
Digital Finance Analysis with Pen and Notebook Image
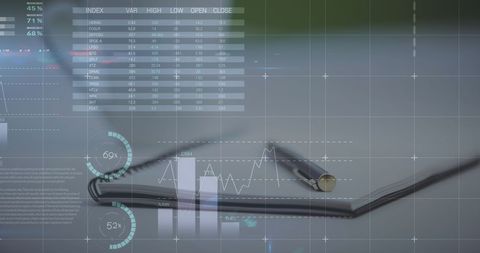
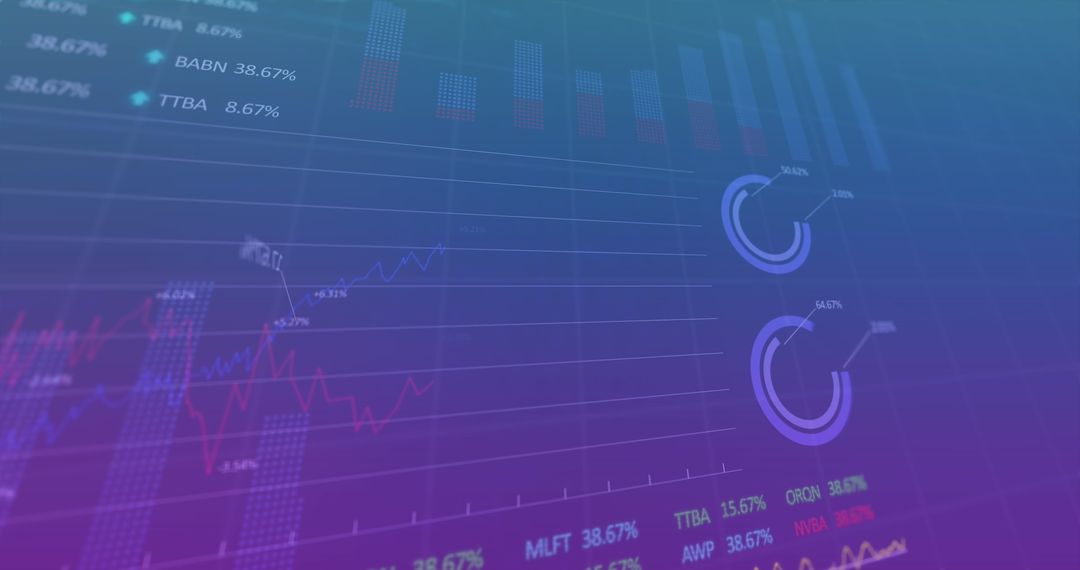
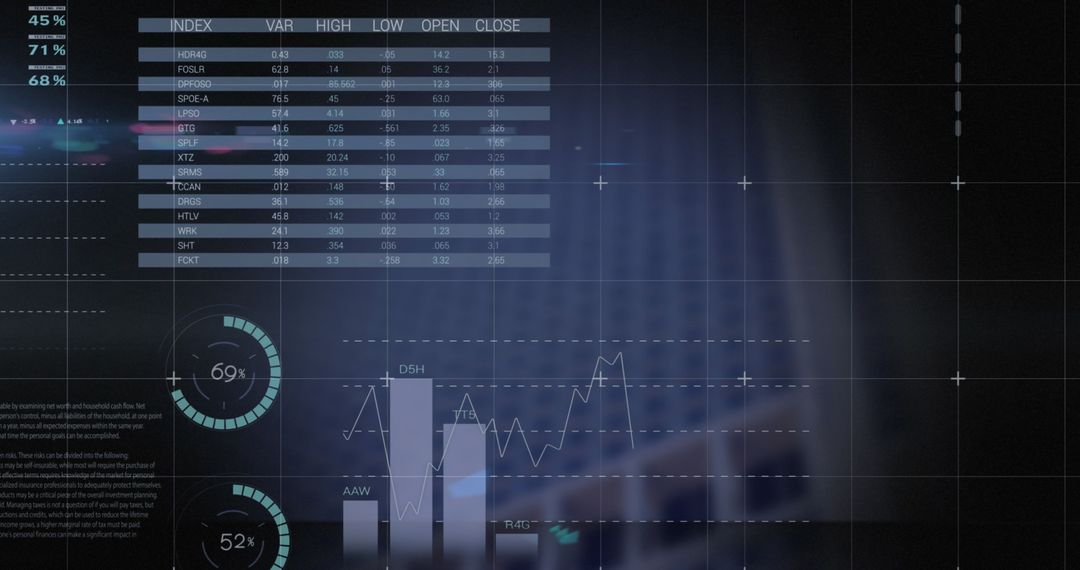
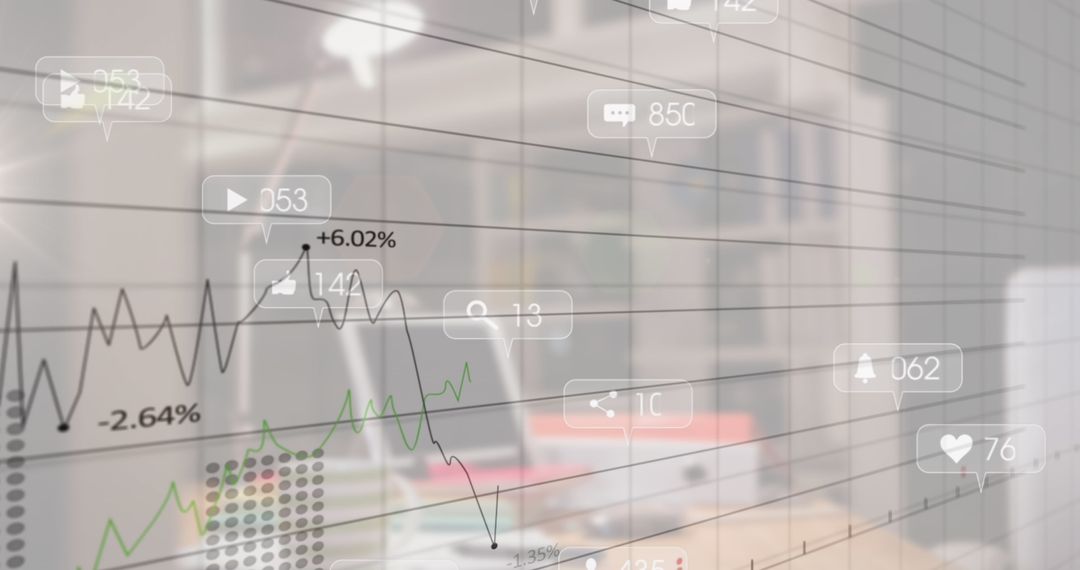
This image depicts the blend of digital technology with traditional office tools, with statistical data charts overlaying a pen and notebook. Ideal for business presentations, fintech articles, or analytical tools branding that emphasizes technology and traditional methods coming together.
Powered by 


2
downloads
downloads
Tags:
More
Credit Photo
If you would like to credit the Photo, here are some ways you can do so
Text Link
photo Link
<span class="text-link">
<span>
<a target="_blank" href=https://pikwizard.com/photo/digital-finance-analysis-with-pen-and-notebook/6d055c25e8d7297cfc0b1903f94f1028/>PikWizard</a>
</span>
</span>
<span class="image-link">
<span
style="margin: 0 0 20px 0; display: inline-block; vertical-align: middle; width: 100%;"
>
<a
target="_blank"
href="https://pikwizard.com/photo/digital-finance-analysis-with-pen-and-notebook/6d055c25e8d7297cfc0b1903f94f1028/"
style="text-decoration: none; font-size: 10px; margin: 0;"
>
<img src="https://pikwizard.com/pw/medium/6d055c25e8d7297cfc0b1903f94f1028.jpg" style="margin: 0; width: 100%;" alt="" />
<p style="font-size: 12px; margin: 0;">PikWizard</p>
</a>
</span>
</span>
Free (free of charge)
Free for personal and commercial use.
Author: Creative Art
Similar Free Stock Images
Premium


Premium


Premium


Premium


Premium


Premium


Premium


Premium


Premium


Premium


Premium


Premium


Premium


Premium


Premium


Premium


Premium


Premium


Premium


Premium


Premium


Premium


Premium


Premium