- Home >
- Stock Photos >
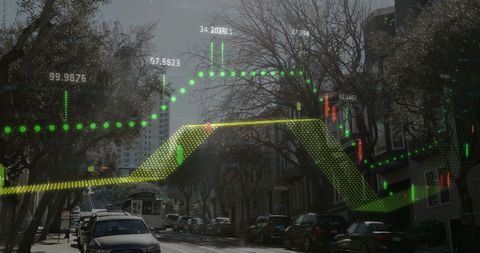
- Digital Finance Analytics in Retail Environment
Digital Finance Analytics in Retail Environment Image

Successful integration of technology in a retail setup involves using digital analytics to inform business strategies. Suitable for content on financial technology innovations, retail analytics processes, or articles focusing on improving ROI through digital tools. Ideal for illustrating advanced business technologies in sector-oriented retail marketing strategies or educational materials on financial applications in retail industries.

downloads
Tags:
More
Credit Photo
If you would like to credit the Photo, here are some ways you can do so
Text Link
photo Link
<span class="text-link">
<span>
<a target="_blank" href=https://pikwizard.com/photo/digital-finance-analytics-in-retail-environment/b5850df084135b263c2f3ca2df4a4e0e/>PikWizard</a>
</span>
</span>
<span class="image-link">
<span
style="margin: 0 0 20px 0; display: inline-block; vertical-align: middle; width: 100%;"
>
<a
target="_blank"
href="https://pikwizard.com/photo/digital-finance-analytics-in-retail-environment/b5850df084135b263c2f3ca2df4a4e0e/"
style="text-decoration: none; font-size: 10px; margin: 0;"
>
<img src="https://pikwizard.com/pw/medium/b5850df084135b263c2f3ca2df4a4e0e.jpg" style="margin: 0; width: 100%;" alt="" />
<p style="font-size: 12px; margin: 0;">PikWizard</p>
</a>
</span>
</span>
Free (free of charge)
Free for personal and commercial use.
Author: People Creations