- Home >
- Stock Photos >
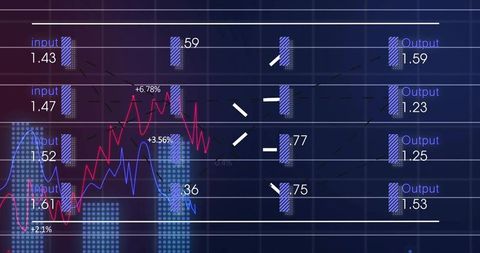
- Digital Finance and Data Visualization Concept with Growing Chart
Digital Finance and Data Visualization Concept with Growing Chart Image

Data projection showing financial trends through dynamic chart representation. Growing lines and numerical overlays imply movement in markets or analytic insights. Ideal for presentations, financial reports, and technology brochures showcasing data analysis and business development.

downloads
Tags:
More
Credit Photo
If you would like to credit the Photo, here are some ways you can do so
Text Link
photo Link
<span class="text-link">
<span>
<a target="_blank" href=https://pikwizard.com/photo/digital-finance-and-data-visualization-concept-with-growing-chart/7db8bba9edec07112a02534216ed8215/>PikWizard</a>
</span>
</span>
<span class="image-link">
<span
style="margin: 0 0 20px 0; display: inline-block; vertical-align: middle; width: 100%;"
>
<a
target="_blank"
href="https://pikwizard.com/photo/digital-finance-and-data-visualization-concept-with-growing-chart/7db8bba9edec07112a02534216ed8215/"
style="text-decoration: none; font-size: 10px; margin: 0;"
>
<img src="https://pikwizard.com/pw/medium/7db8bba9edec07112a02534216ed8215.jpg" style="margin: 0; width: 100%;" alt="" />
<p style="font-size: 12px; margin: 0;">PikWizard</p>
</a>
</span>
</span>
Free (free of charge)
Free for personal and commercial use.
Author: People Creations