- Home >
- Stock Photos >
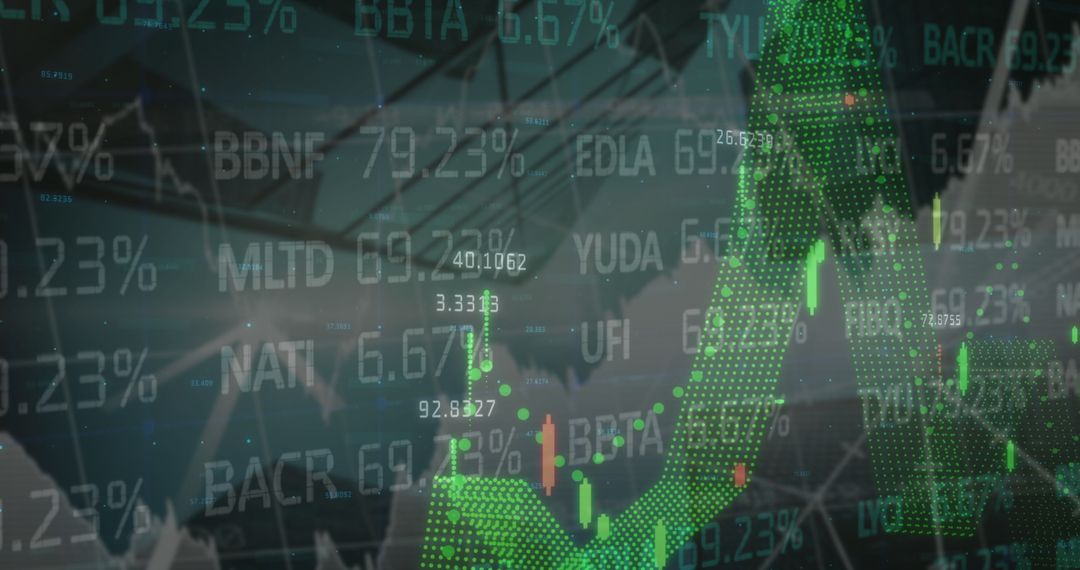
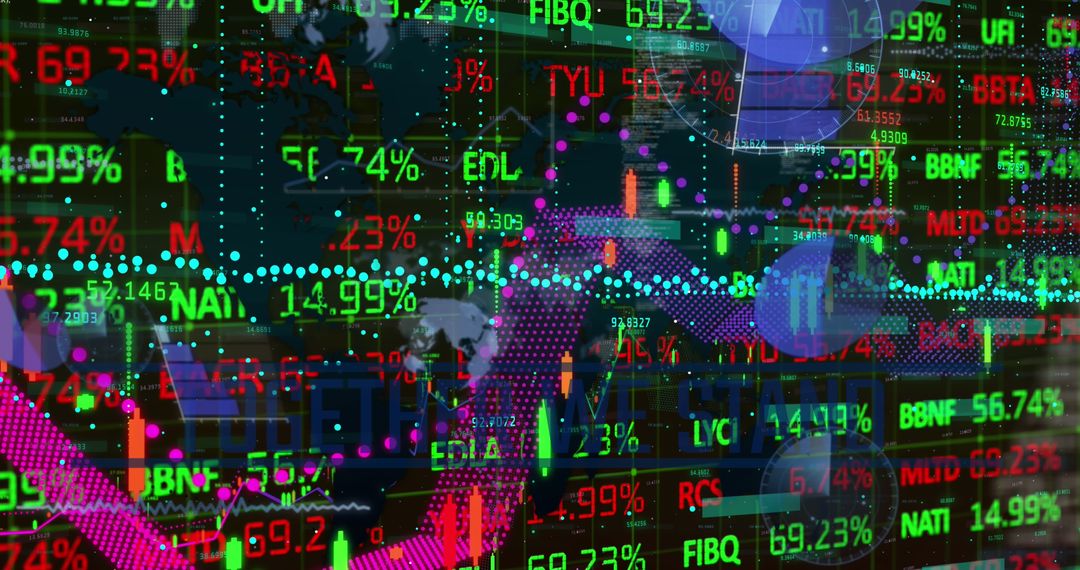
- Digital Finance Charts with Networking Background
Digital Finance Charts with Networking Background Image

Finance charts with digital graphics merging networking and business concepts reflect growth, fluctuation. Ideal for illustrating themes in finance tech, data trends, business network strategies. Useful for campaigns in fintech solutions, economic news presentations.
Powered by  - Get 15% off with code: PIKWIZARD15


2
downloads
downloads
Tags:
More
Credit Photo
If you would like to credit the Photo, here are some ways you can do so
Text Link
photo Link
<span class="text-link">
<span>
<a target="_blank" href=https://pikwizard.com/photo/digital-finance-charts-with-networking-background/c2f8ef3d326d8897f20545a1d36ca2e4/>PikWizard</a>
</span>
</span>
<span class="image-link">
<span
style="margin: 0 0 20px 0; display: inline-block; vertical-align: middle; width: 100%;"
>
<a
target="_blank"
href="https://pikwizard.com/photo/digital-finance-charts-with-networking-background/c2f8ef3d326d8897f20545a1d36ca2e4/"
style="text-decoration: none; font-size: 10px; margin: 0;"
>
<img src="https://pikwizard.com/pw/medium/c2f8ef3d326d8897f20545a1d36ca2e4.jpg" style="margin: 0; width: 100%;" alt="" />
<p style="font-size: 12px; margin: 0;">PikWizard</p>
</a>
</span>
</span>
Free (free of charge)
Free for personal and commercial use.
Author: Authentic Images
Similar Free Stock Images

Premium


Premium


Premium


Premium


Premium


Premium


Premium


Premium


Premium


Premium


Premium


Premium


Premium


Premium


Premium


Premium


Premium


Premium


Premium


Premium


Premium


Premium


Premium


Premium