
- Home >
- Stock Photos >
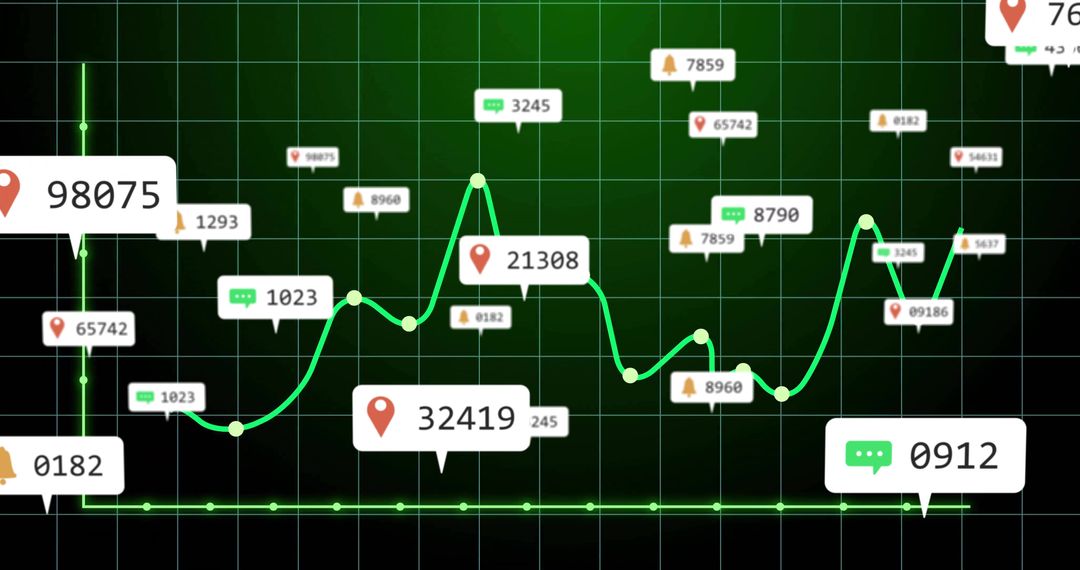
- Digital Finance Dashboard Showing Candlestick and Line Charts
Digital Finance Dashboard Showing Candlestick and Line Charts Image

This image showcases a digital finance dashboard with green candlestick bars and line graphs in green and purple, representing market trends and stock analysis. Ideal for articles about financial market analysis, investment strategies, data-driven decision-making, or technology and finance integration. Useful for websites, finance blog posts, and educational resources focusing on technology in finance and investment insights.
Powered by  - Get 15% off with code: PIKWIZARD15


0
downloads
downloads
Tags:
More
Credit Photo
If you would like to credit the Photo, here are some ways you can do so
Text Link
photo Link
<span class="text-link">
<span>
<a target="_blank" href=https://pikwizard.com/photo/digital-finance-dashboard-showing-candlestick-and-line-charts/7de3b8208a50af6df7fedc336d1e9836/>PikWizard</a>
</span>
</span>
<span class="image-link">
<span
style="margin: 0 0 20px 0; display: inline-block; vertical-align: middle; width: 100%;"
>
<a
target="_blank"
href="https://pikwizard.com/photo/digital-finance-dashboard-showing-candlestick-and-line-charts/7de3b8208a50af6df7fedc336d1e9836/"
style="text-decoration: none; font-size: 10px; margin: 0;"
>
<img src="https://pikwizard.com/pw/medium/7de3b8208a50af6df7fedc336d1e9836.jpg" style="margin: 0; width: 100%;" alt="" />
<p style="font-size: 12px; margin: 0;">PikWizard</p>
</a>
</span>
</span>
Free (free of charge)
Free for personal and commercial use.
Author: Awesome Content
Similar Free Stock Images

Premium


Premium


Premium


Premium


Premium


Premium


Premium


Premium


Premium


Premium


Premium


Premium


Premium


Premium


Premium


Premium


Premium


Premium


Premium


Premium


Premium


Premium


Premium


Premium

