- Home >
- Stock Photos >
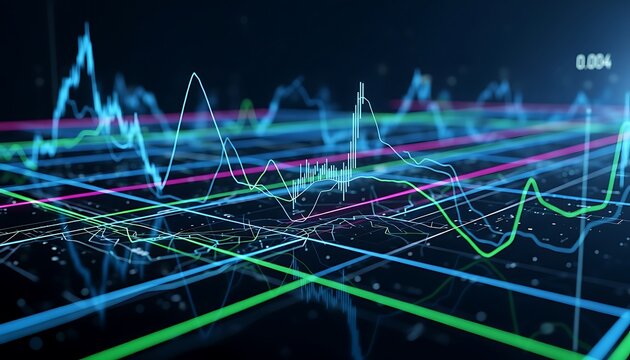
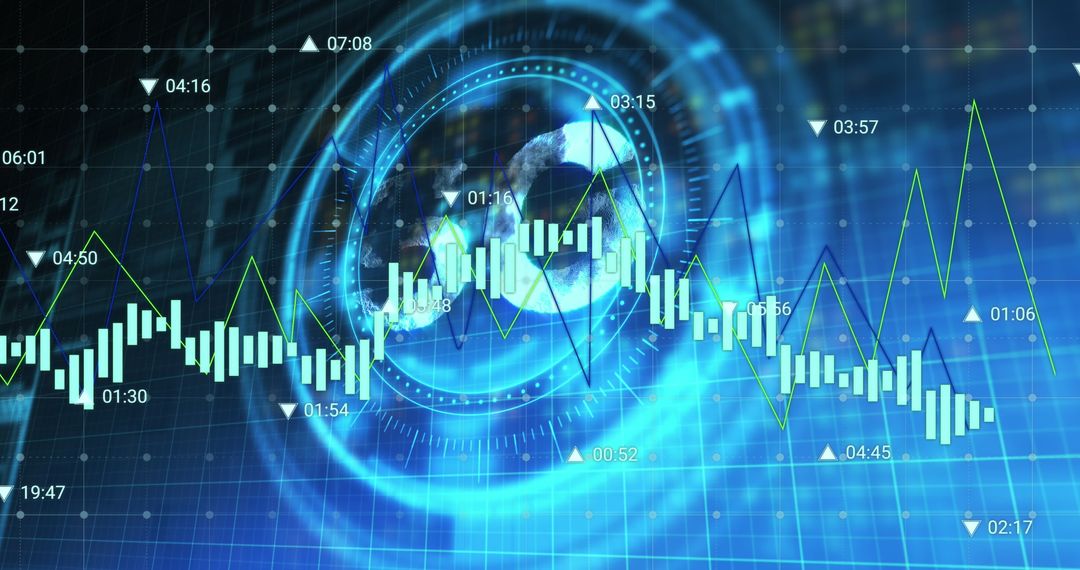
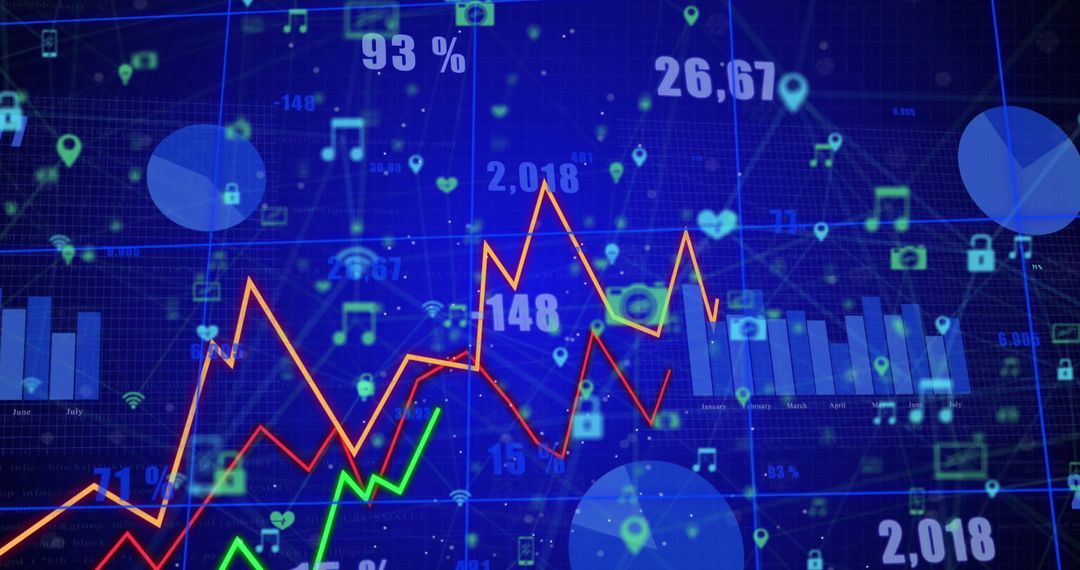
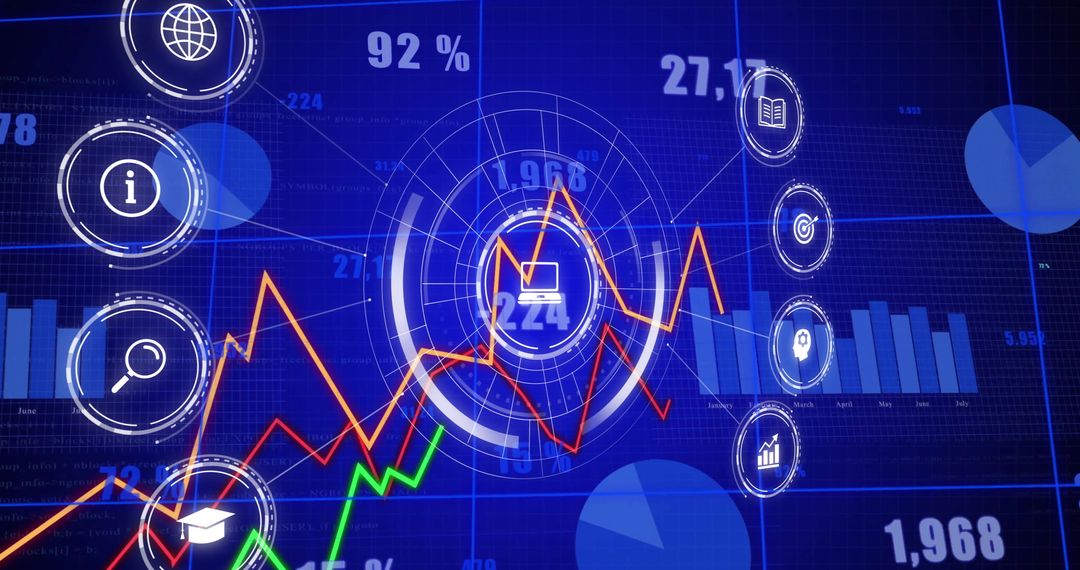
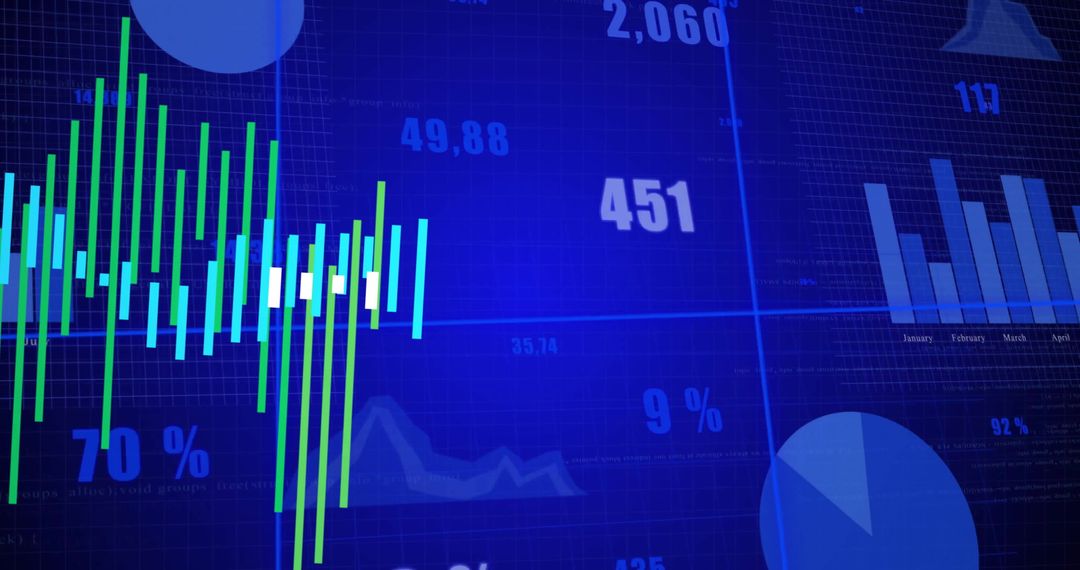
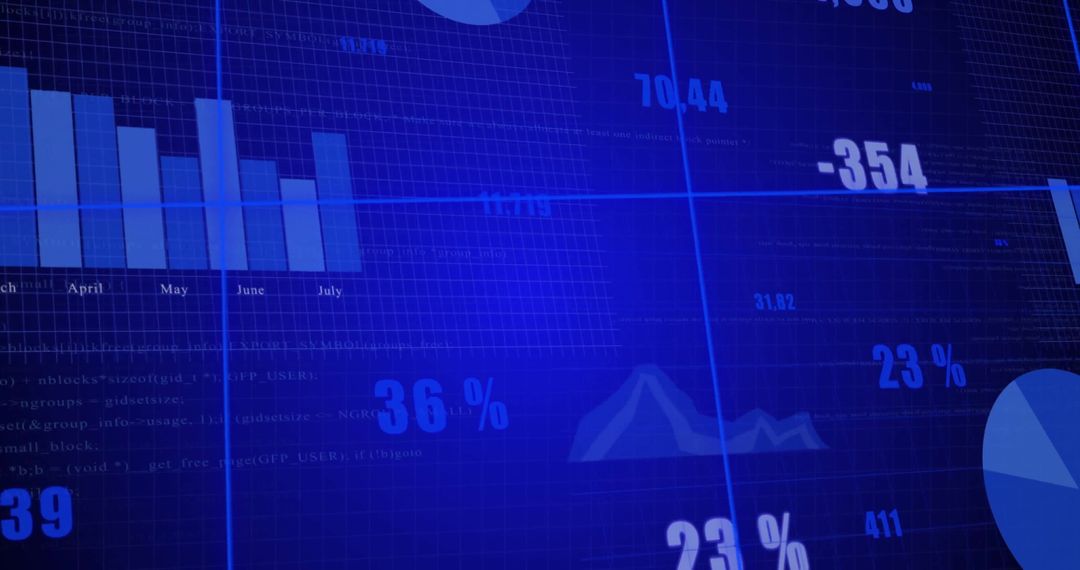
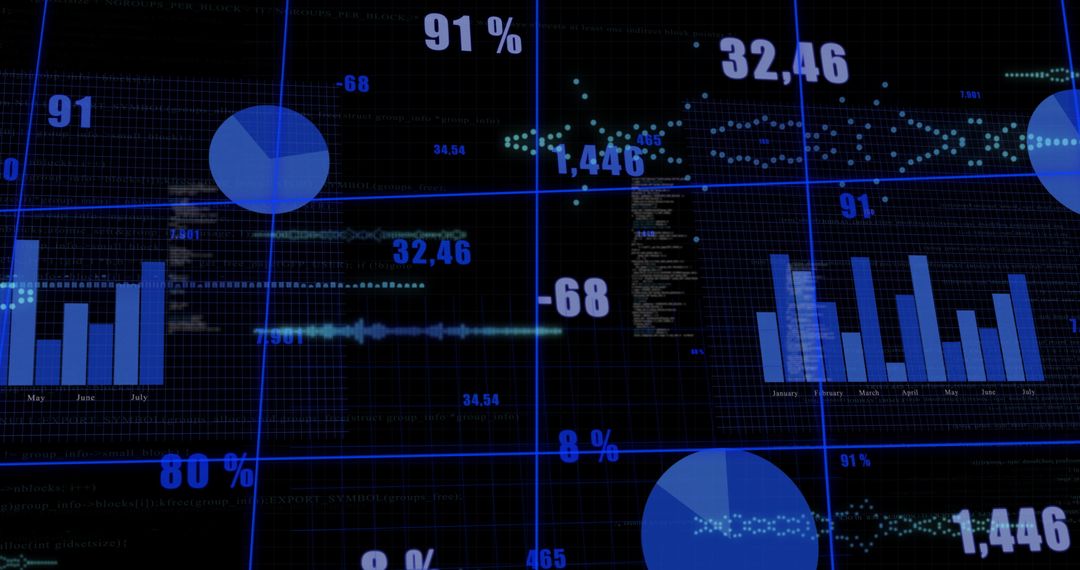
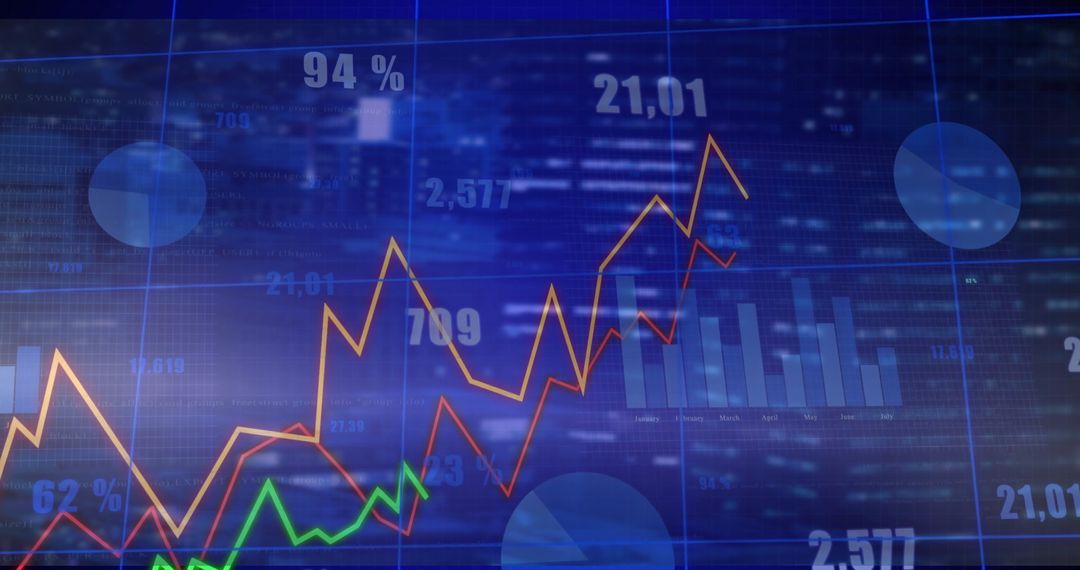
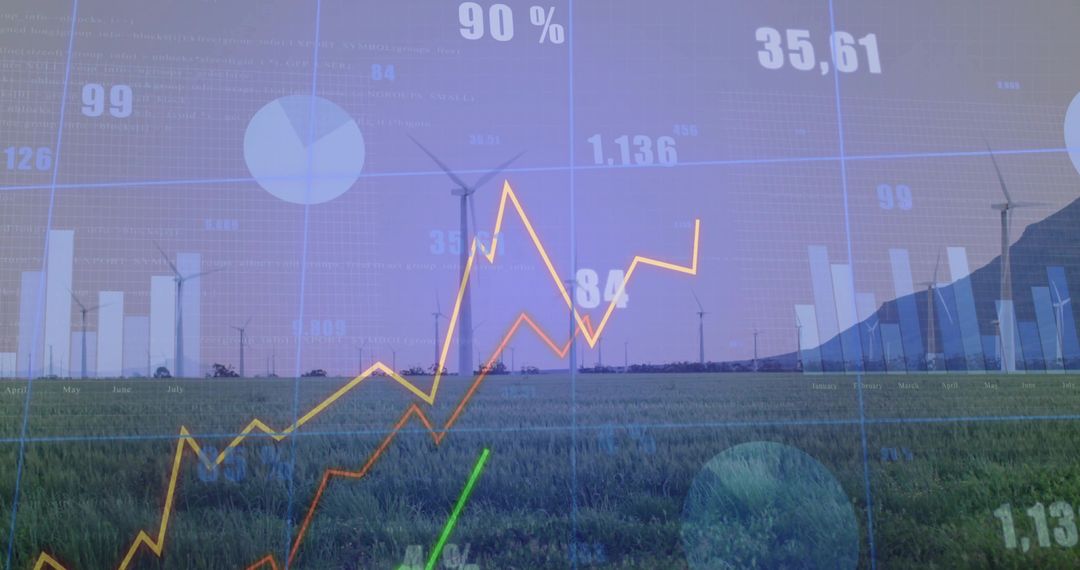
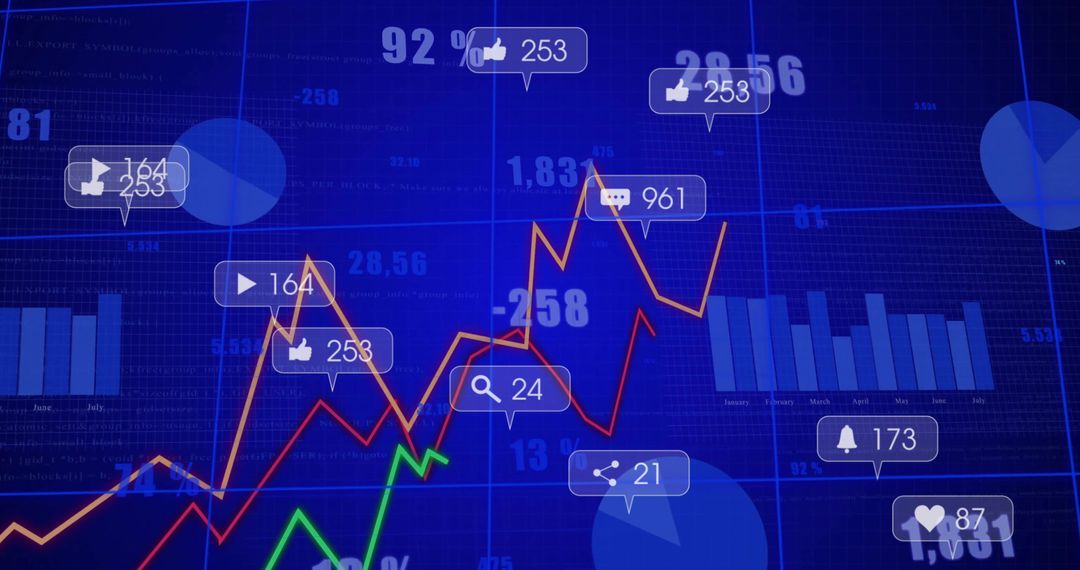
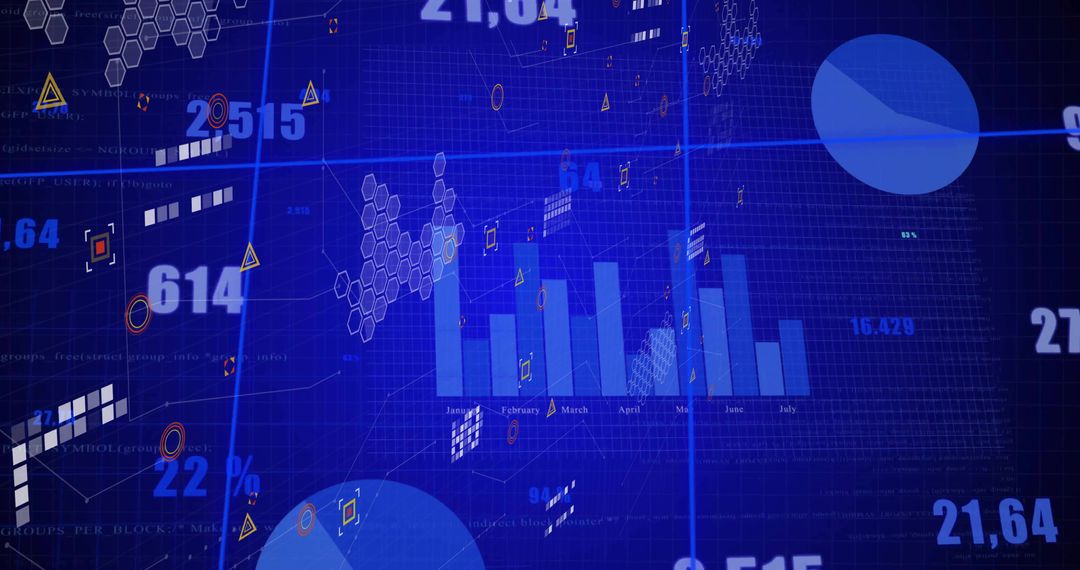
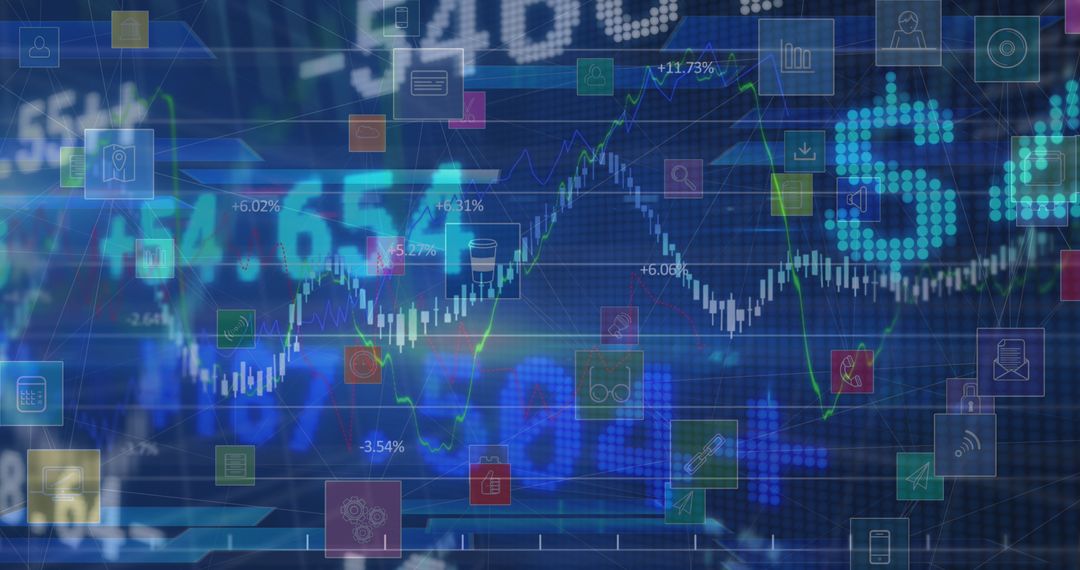
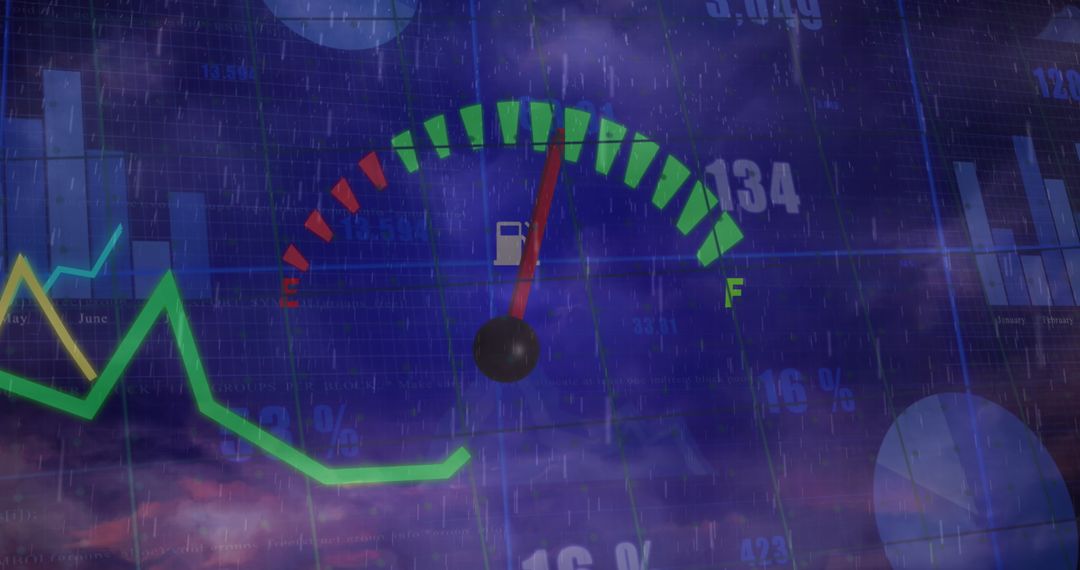
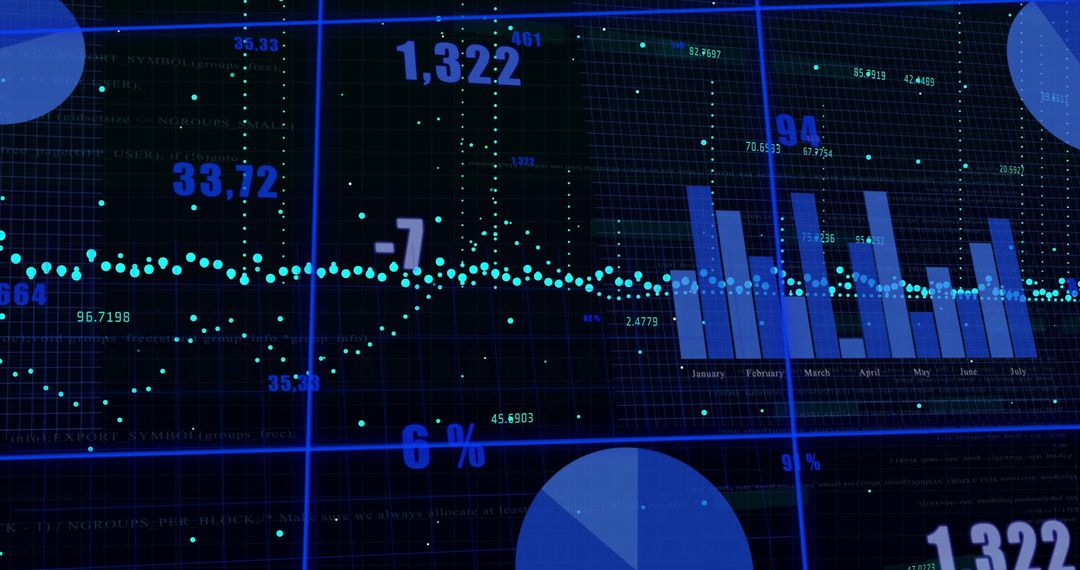
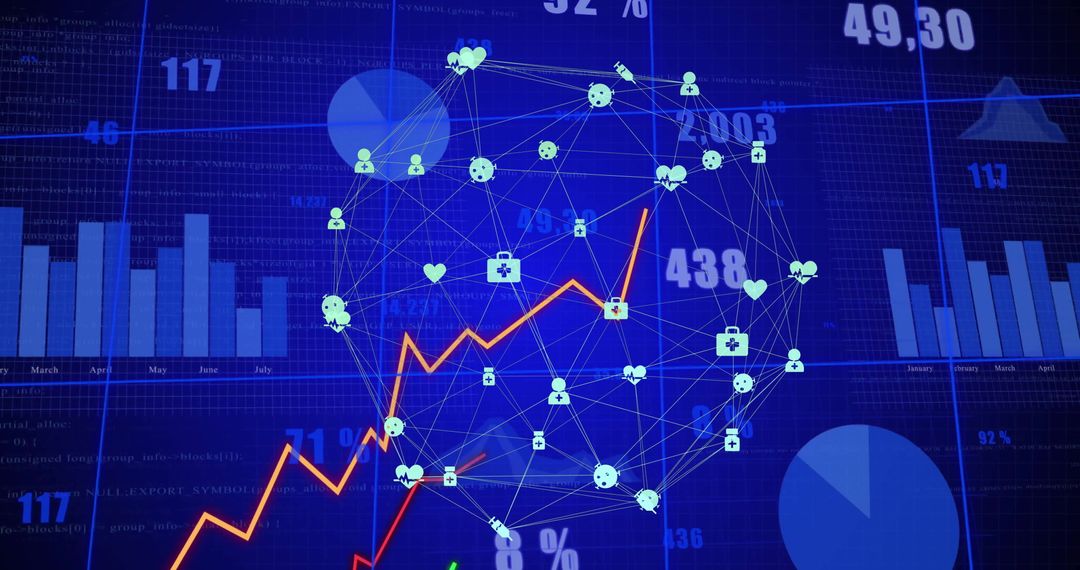
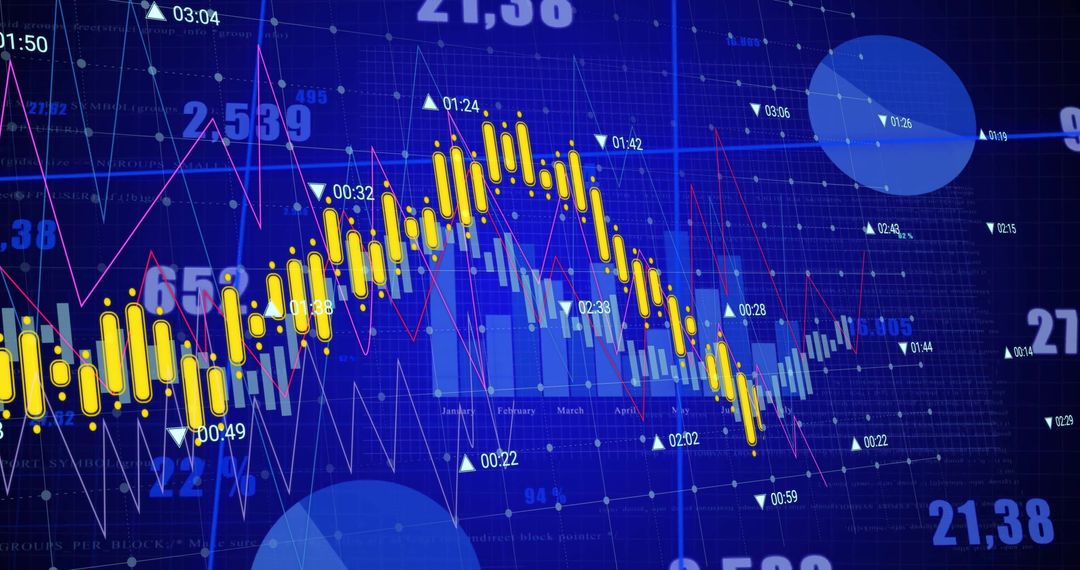
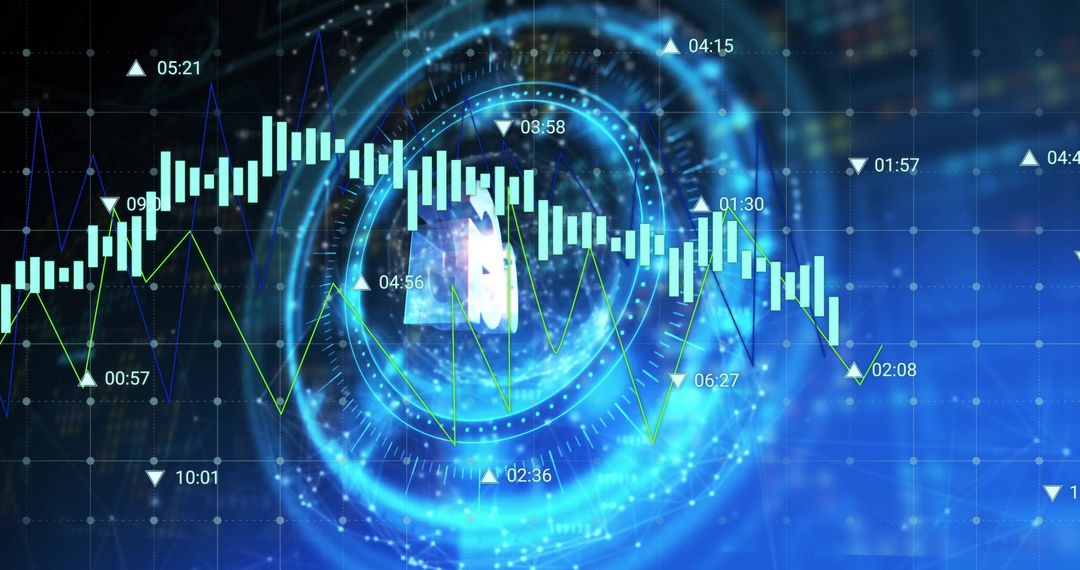
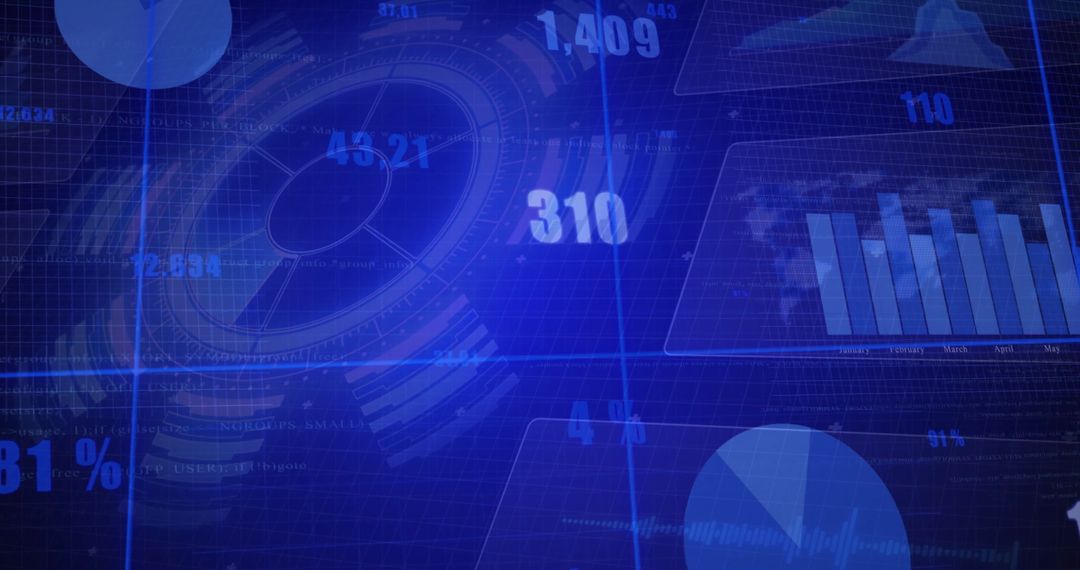
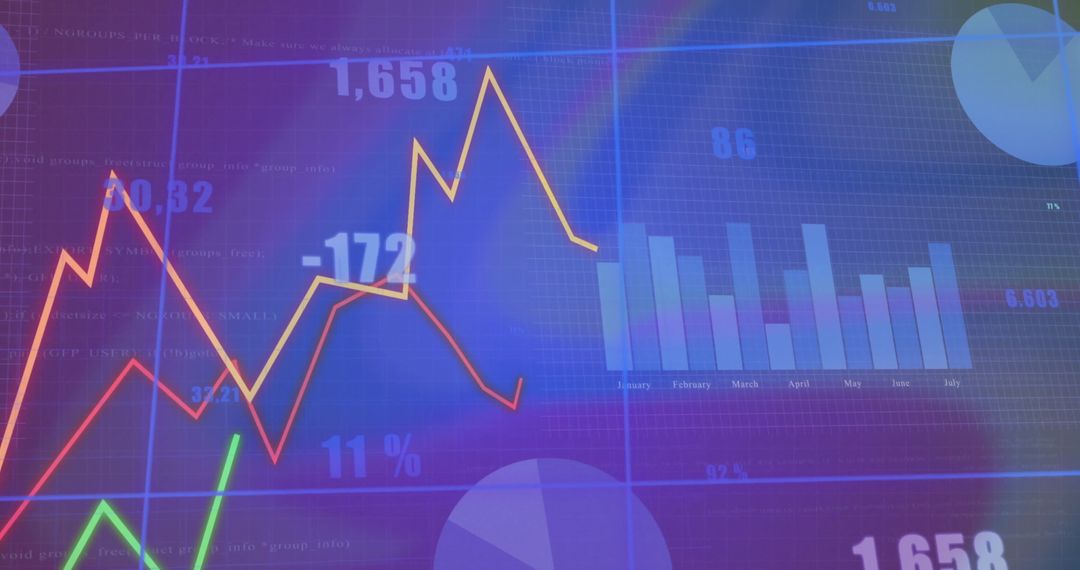
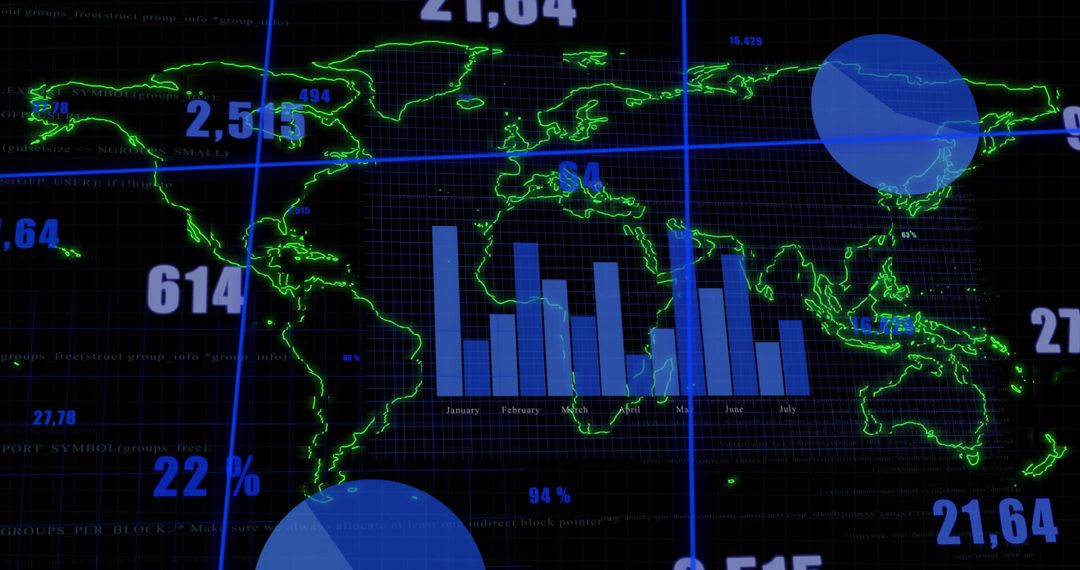
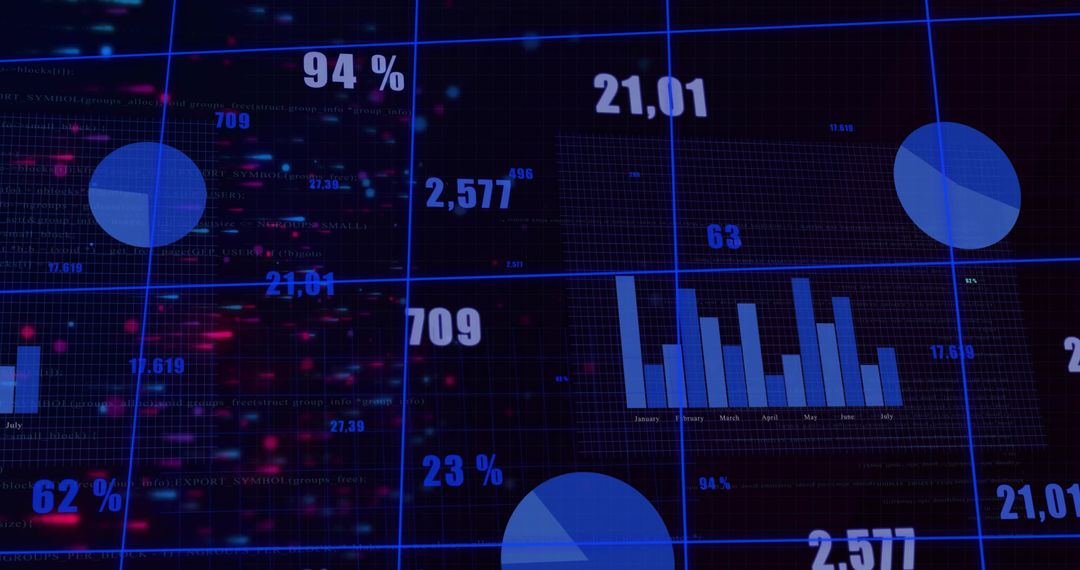
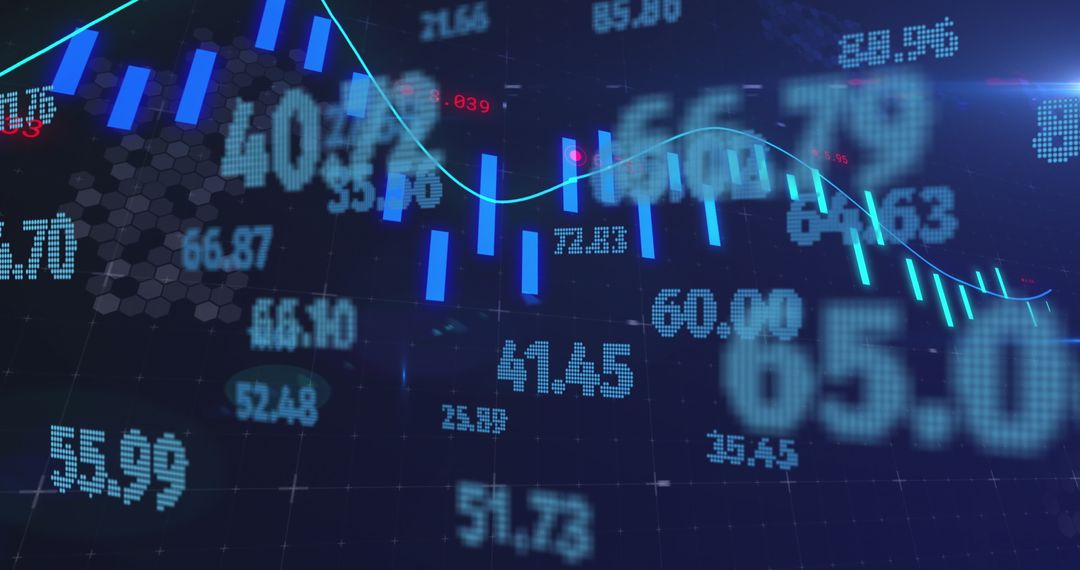
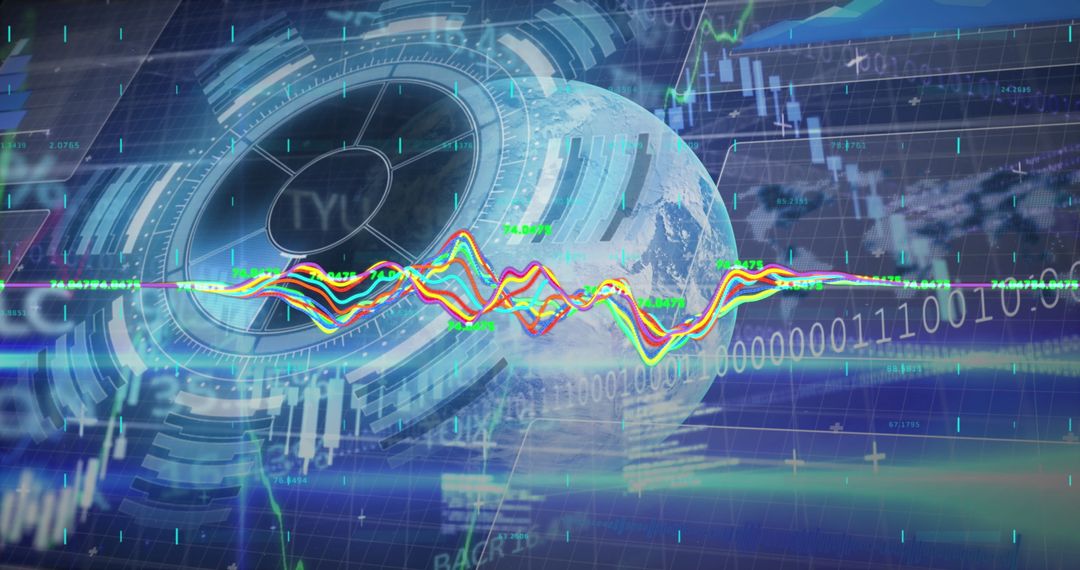
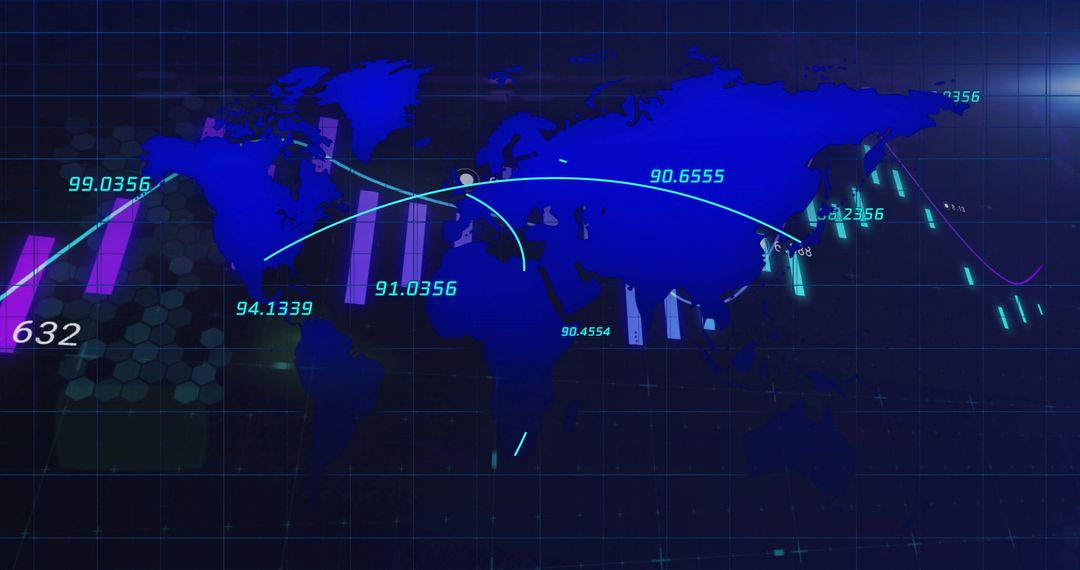
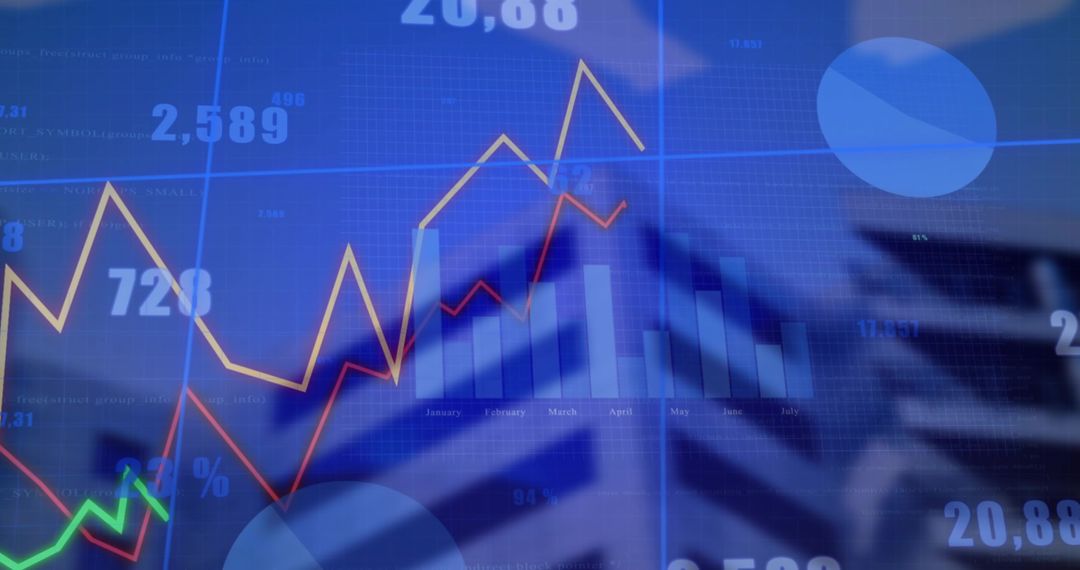
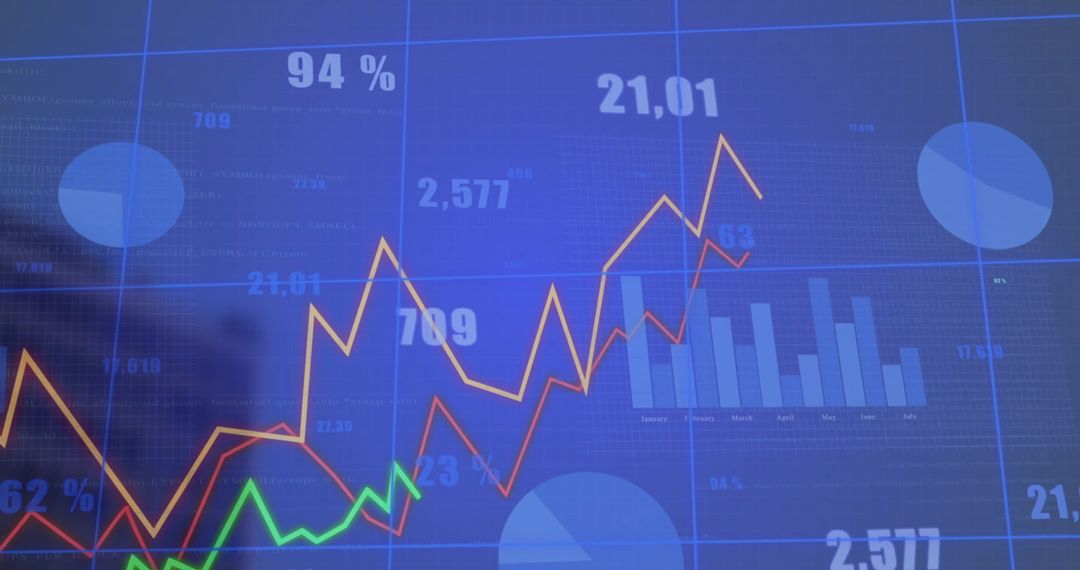
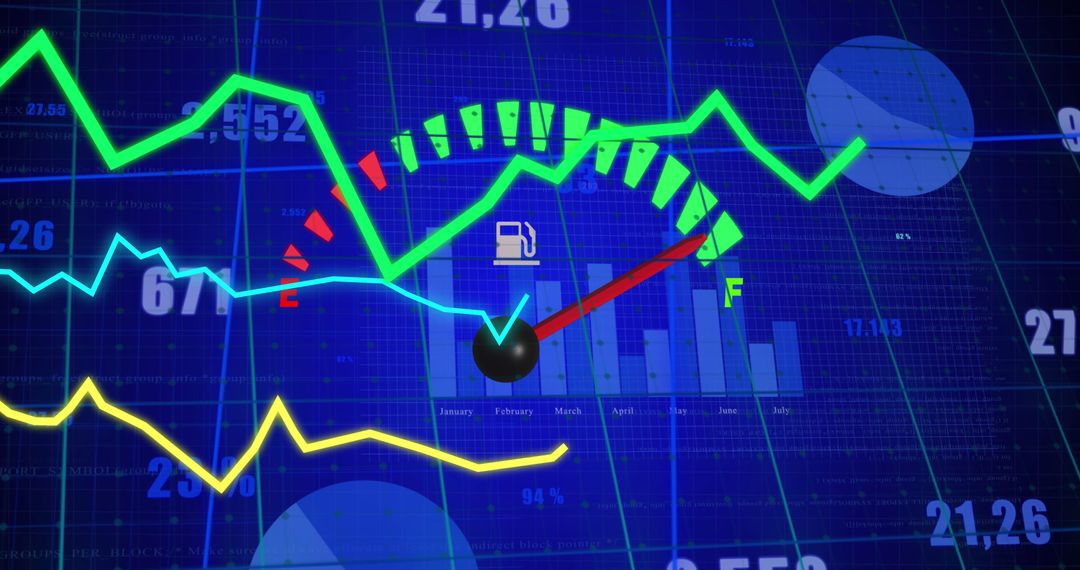
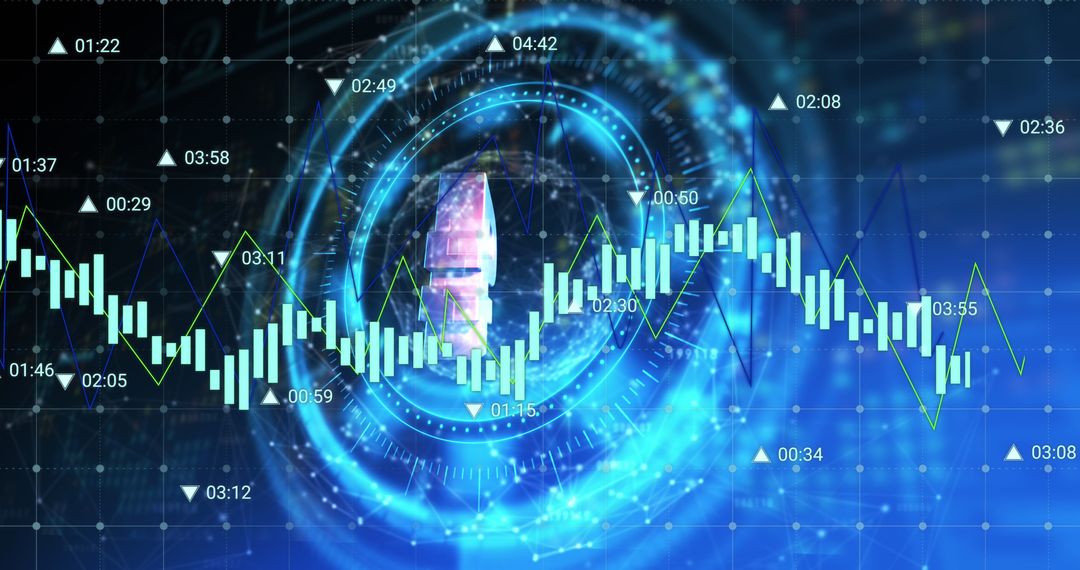
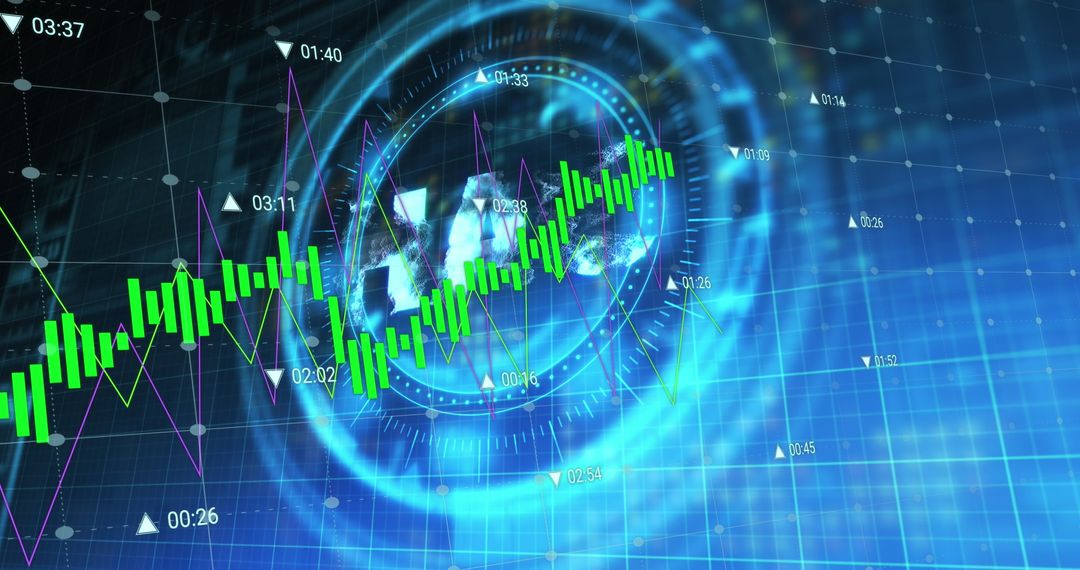
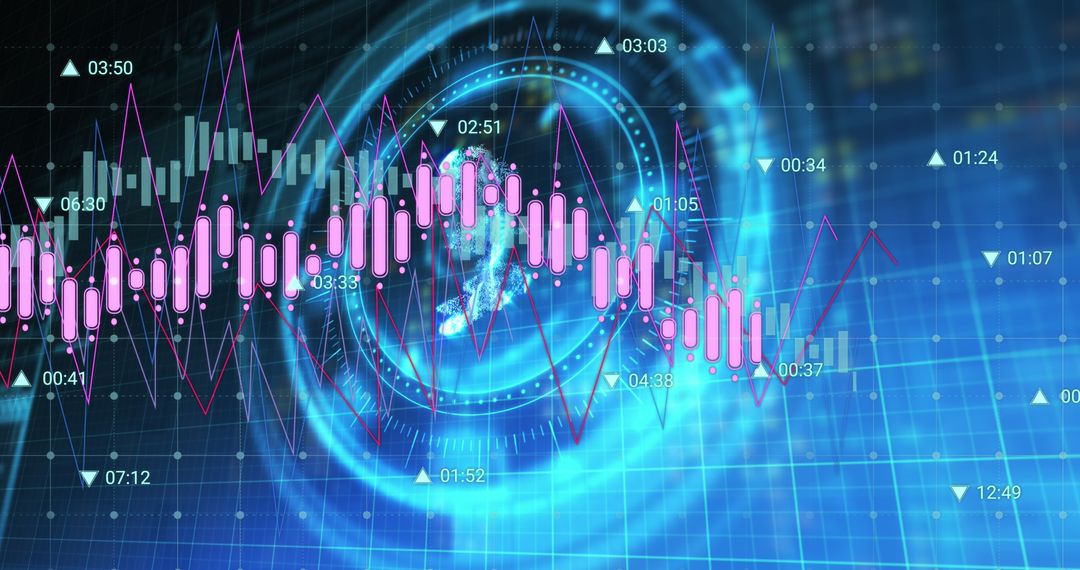
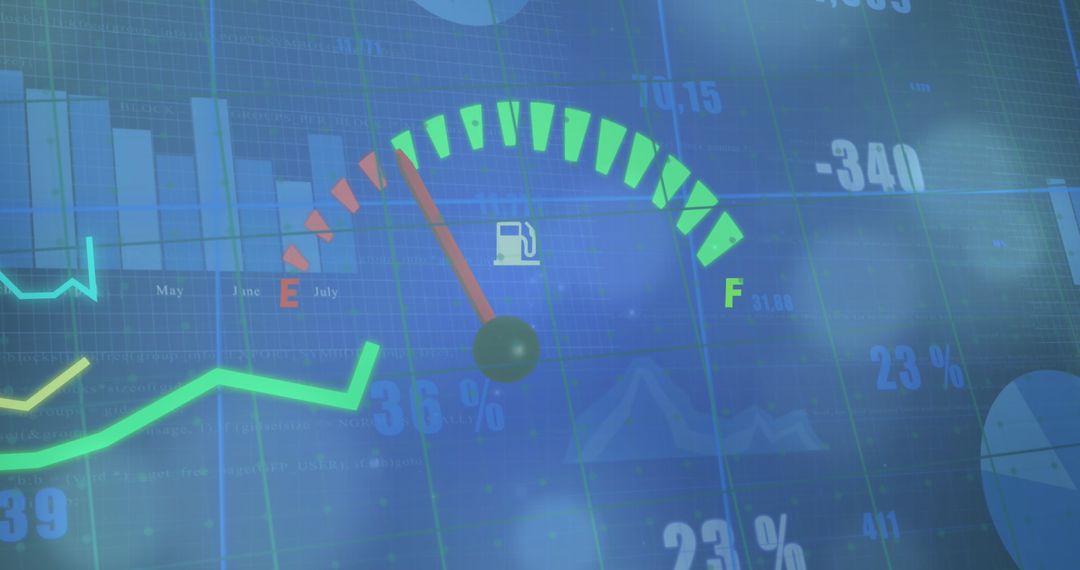
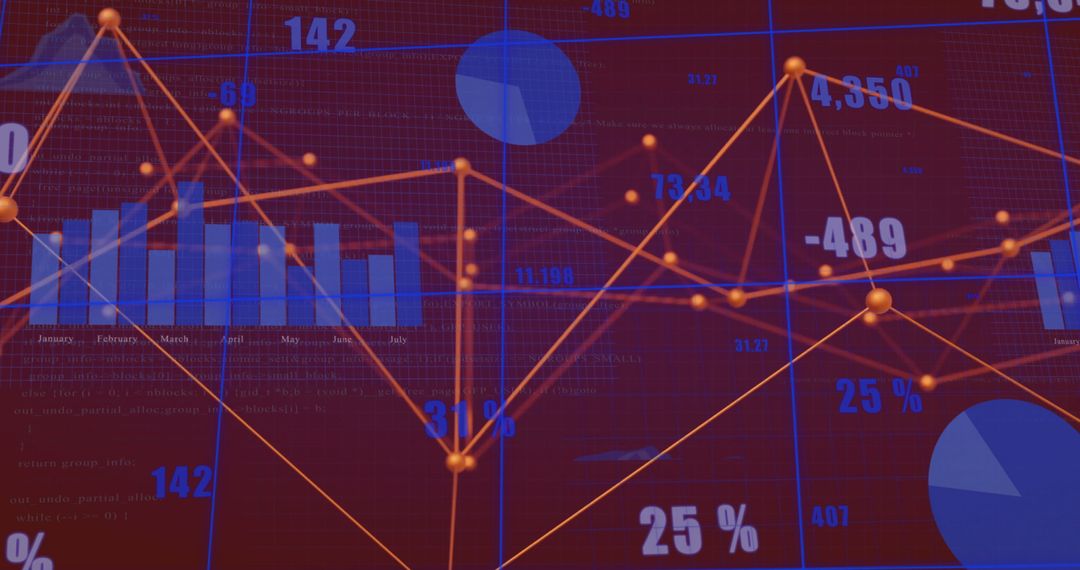
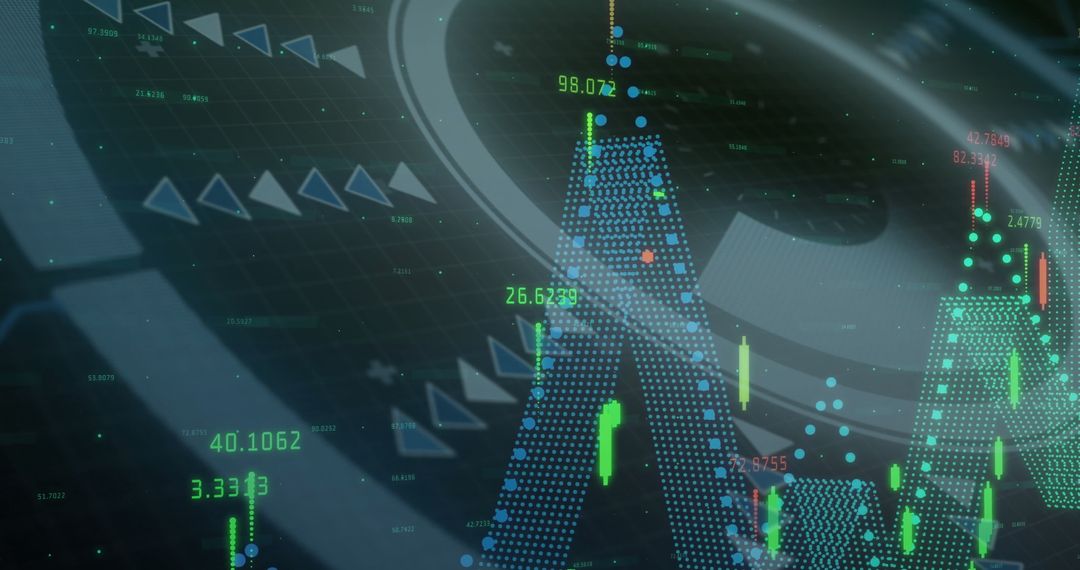
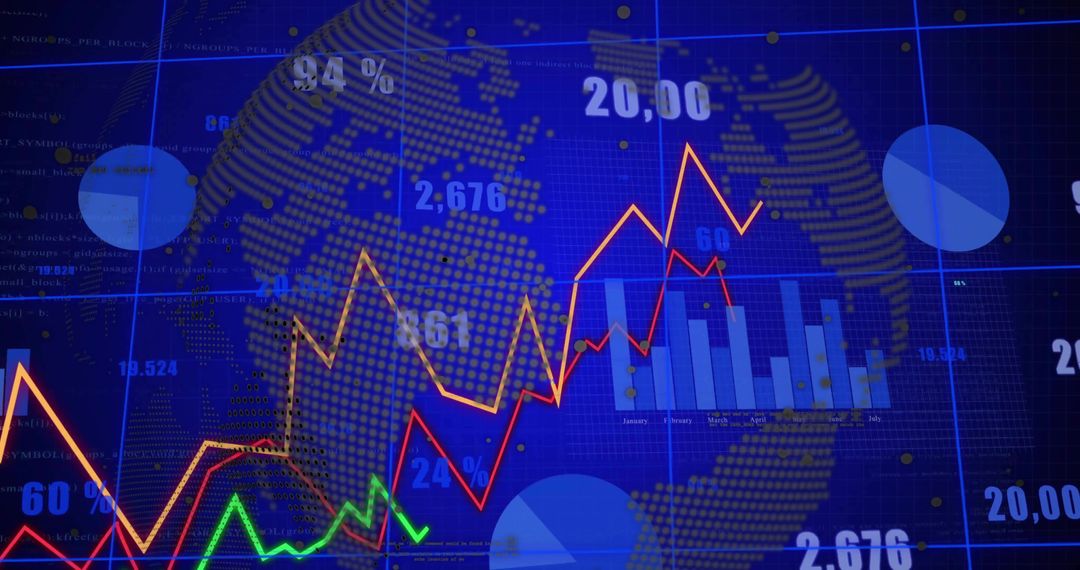
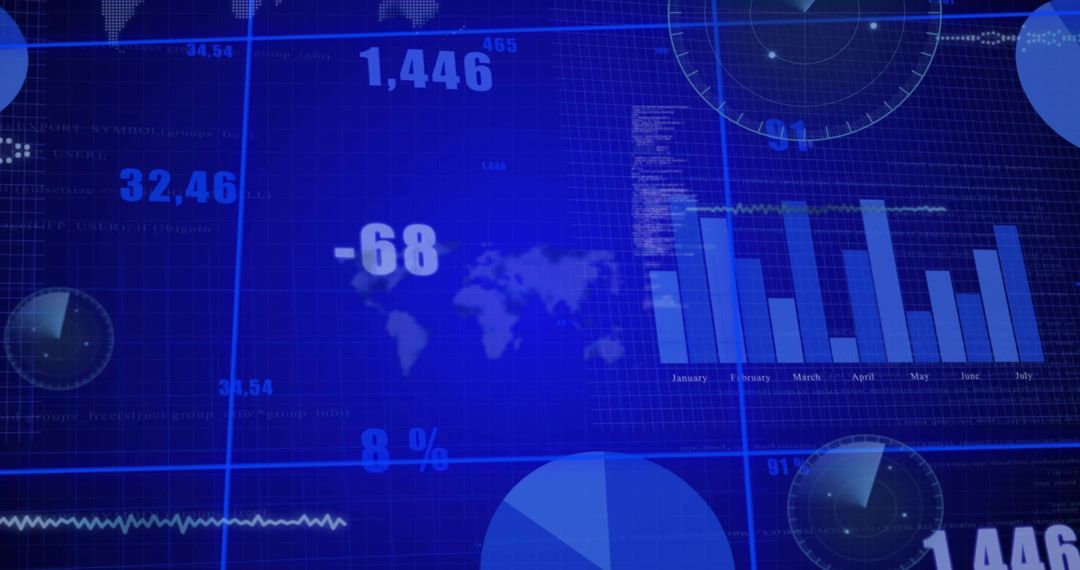
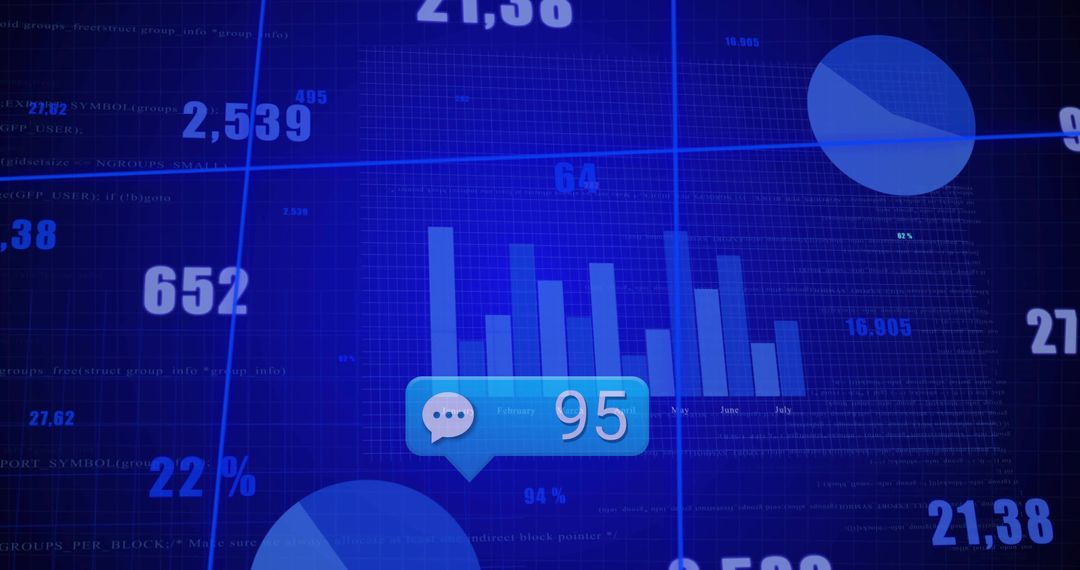
- Digital Finance Dashboard Visualizing Time-Series Lines, Monthly Bars and Binary Globe
Digital Finance Dashboard Visualizing Time-Series Lines, Monthly Bars and Binary Globe Image

Dynamic blue dashboard featuring overlapping time-series lines, monthly bar chart, and binary-tech globe visualizing numeric data. Emphasizing market volatility, trend analysis, and performance metrics for finance, trading, and analytics projects. Perfect for corporate presentations, pitch decks, annual reports, investor updates, fintech websites, and data science blog headers. Working well as slide background, hero banner, social media post, or brochure cover. Customizing color overlays and annotations helping match brand style and highlighting key data points. Delivering modern, high-tech visual for content about trading strategies, investment insights, business intelligence, and digital transformation.
Powered by 


0
downloads
downloads
Tags:
More
Credit Photo
If you would like to credit the Photo, here are some ways you can do so
Text Link
photo Link
<span class="text-link">
<span>
<a target="_blank" href=https://pikwizard.com/photo/digital-finance-dashboard-visualizing-time-series-lines-monthly-bars-and-binary-globe/171cbe201256e92280733b329dbba742/>PikWizard</a>
</span>
</span>
<span class="image-link">
<span
style="margin: 0 0 20px 0; display: inline-block; vertical-align: middle; width: 100%;"
>
<a
target="_blank"
href="https://pikwizard.com/photo/digital-finance-dashboard-visualizing-time-series-lines-monthly-bars-and-binary-globe/171cbe201256e92280733b329dbba742/"
style="text-decoration: none; font-size: 10px; margin: 0;"
>
<img src="https://pikwizard.com/pw/medium/171cbe201256e92280733b329dbba742.jpg" style="margin: 0; width: 100%;" alt="" />
<p style="font-size: 12px; margin: 0;">PikWizard</p>
</a>
</span>
</span>
Free (free of charge)
Free for personal and commercial use.
Author: People Creations
Similar Free Stock Images

Premium


Premium


Premium

Premium


Premium

Premium


Premium


Premium


Premium


Premium


Premium


Premium


Premium

Premium

Premium


Premium


Premium


Premium


Premium


Premium


Premium


Premium


Premium


Premium