
- Home >
- Stock Photos >
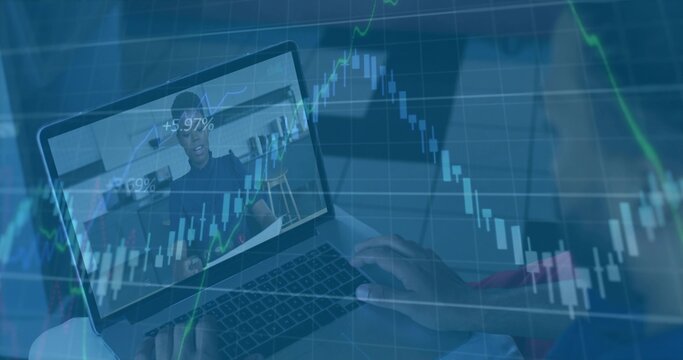
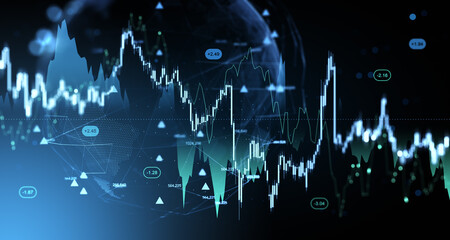
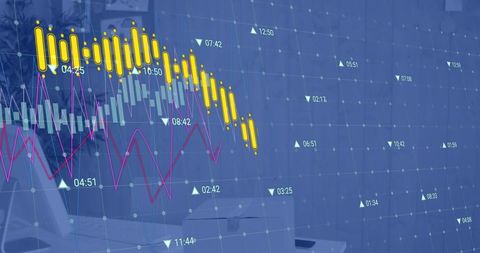
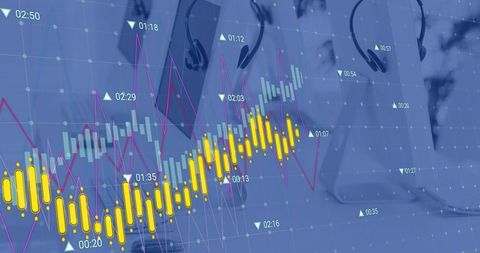
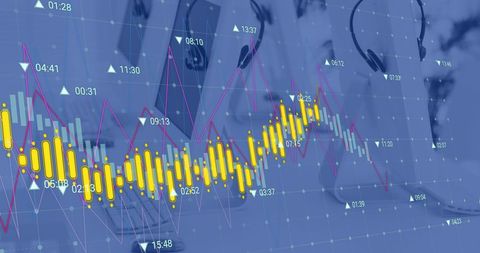
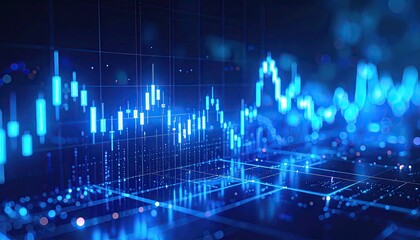
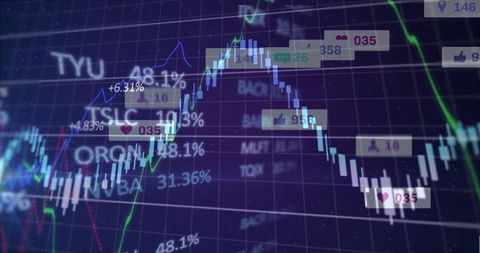
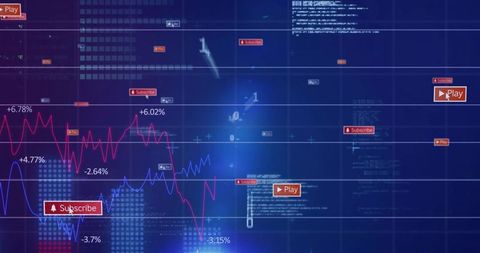
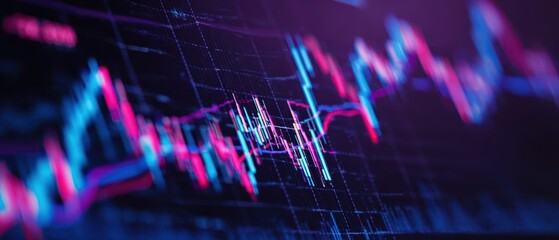
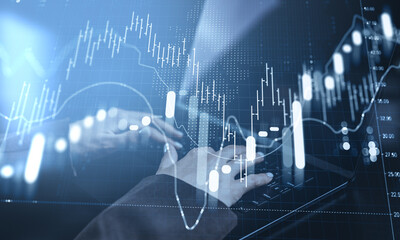
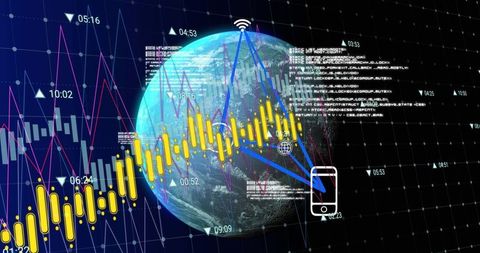
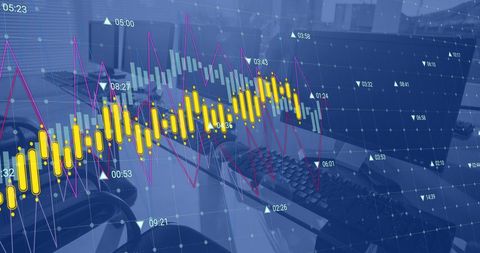
- Digital Finance Dashboard with Candlestick Chart and Analytics
Digital Finance Dashboard with Candlestick Chart and Analytics Image

Digital display of a trading dashboard showcasing various financial data visualizations including candlestick charts and line graphs. Ideal for use in articles or presentations about trading platforms, financial analysis, or digital investing tools. Beneficial for financial advisors, stock traders, and educators needing visual aids in technology-focused finance discussions.
Powered by 


downloads
Tags:
More
Credit Photo
If you would like to credit the Photo, here are some ways you can do so
Text Link
photo Link
<span class="text-link">
<span>
<a target="_blank" href=https://pikwizard.com/photo/digital-finance-dashboard-with-candlestick-chart-and-analytics/fccee8e5970f8deadc2dbf89d96e682d/>PikWizard</a>
</span>
</span>
<span class="image-link">
<span
style="margin: 0 0 20px 0; display: inline-block; vertical-align: middle; width: 100%;"
>
<a
target="_blank"
href="https://pikwizard.com/photo/digital-finance-dashboard-with-candlestick-chart-and-analytics/fccee8e5970f8deadc2dbf89d96e682d/"
style="text-decoration: none; font-size: 10px; margin: 0;"
>
<img src="https://pikwizard.com/pw/medium/fccee8e5970f8deadc2dbf89d96e682d.jpg" style="margin: 0; width: 100%;" alt="" />
<p style="font-size: 12px; margin: 0;">PikWizard</p>
</a>
</span>
</span>
Free (free of charge)
Free for personal and commercial use.
Author: Awesome Content
Similar Free Stock Images

Premium


Premium

Premium


Premium


Premium
Premium
Premium


Premium

Premium


Premium
Premium
Premium


Premium


Premium


Premium


Premium


Premium


Premium


Premium


Premium


Premium


Premium
Premium


Premium


Premium


Explore More Free Stock Images