- Home >
- Stock Photos >
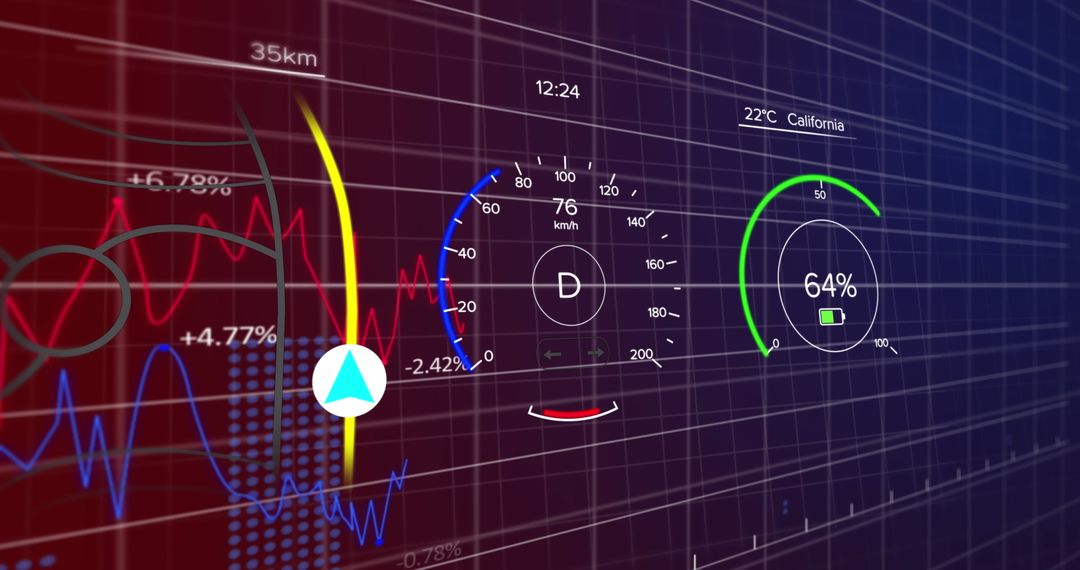
- Digital Finance Dashboard with Rising Graph and Percentages
Digital Finance Dashboard with Rising Graph and Percentages Image

Graphic showcasing an upward trend line along a digital grid, displaying analytics with percentage markers and dotted bars. Ideal for illustrating financial growth, stock market trends, business performance, or economic data reporting. Useful in presentations, articles, or any content related to market analytics and digital finance.
Powered by 


2
downloads
downloads
Tags:
More
Credit Photo
If you would like to credit the Photo, here are some ways you can do so
Text Link
photo Link
<span class="text-link">
<span>
<a target="_blank" href=https://pikwizard.com/photo/digital-finance-dashboard-with-rising-graph-and-percentages/79656a9c8f542e066a68fcd7dc4cef62/>PikWizard</a>
</span>
</span>
<span class="image-link">
<span
style="margin: 0 0 20px 0; display: inline-block; vertical-align: middle; width: 100%;"
>
<a
target="_blank"
href="https://pikwizard.com/photo/digital-finance-dashboard-with-rising-graph-and-percentages/79656a9c8f542e066a68fcd7dc4cef62/"
style="text-decoration: none; font-size: 10px; margin: 0;"
>
<img src="https://pikwizard.com/pw/medium/79656a9c8f542e066a68fcd7dc4cef62.jpg" style="margin: 0; width: 100%;" alt="" />
<p style="font-size: 12px; margin: 0;">PikWizard</p>
</a>
</span>
</span>
Free (free of charge)
Free for personal and commercial use.
Author: People Creations
Similar Free Stock Images

Premium


Premium


Premium


Premium


Premium


Premium


Premium


Premium


Premium


Premium


Premium


Premium


Premium


Premium


Premium


Premium


Premium


Premium


Premium


Premium


Premium


Premium


Premium


Premium