
- Home >
- Stock Photos >
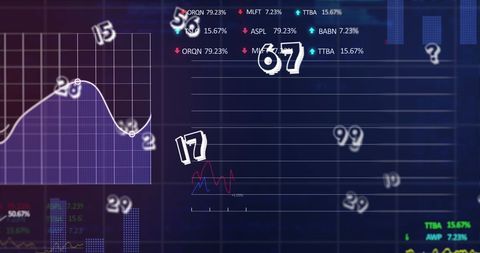
- Digital Finance Data Analysis Over Grid Background
Digital Finance Data Analysis Over Grid Background Image

Illustrates concepts of finance and data analytics in the digital age. Useful for articles on global finance, economic trends, stock market analysis, and the impact of computing on business processes. Perfect for slideshows, reports, and digital presentations focused on economic growth, data interpretation, and financial strategies.
Powered by  - Get 15% off with code: PIKWIZARD15


downloads
Tags:
More
Credit Photo
If you would like to credit the Photo, here are some ways you can do so
Text Link
photo Link
<span class="text-link">
<span>
<a target="_blank" href=https://pikwizard.com/photo/digital-finance-data-analysis-over-grid-background/db1bf6363025c9502ce54373795ad4f8/>PikWizard</a>
</span>
</span>
<span class="image-link">
<span
style="margin: 0 0 20px 0; display: inline-block; vertical-align: middle; width: 100%;"
>
<a
target="_blank"
href="https://pikwizard.com/photo/digital-finance-data-analysis-over-grid-background/db1bf6363025c9502ce54373795ad4f8/"
style="text-decoration: none; font-size: 10px; margin: 0;"
>
<img src="https://pikwizard.com/pw/medium/db1bf6363025c9502ce54373795ad4f8.jpg" style="margin: 0; width: 100%;" alt="" />
<p style="font-size: 12px; margin: 0;">PikWizard</p>
</a>
</span>
</span>
Free (free of charge)
Free for personal and commercial use.
Author: Creative Art
Similar Free Stock Images

Premium


Premium


Premium


Premium

Premium


Premium


Premium


Premium

Premium


Premium


Premium

Premium


Premium


Premium

Premium


Premium


Premium


Premium


Premium


Premium

Premium


Premium

Premium

Premium


Premium


Explore More Free Stock Images