- Home >
- Stock Photos >
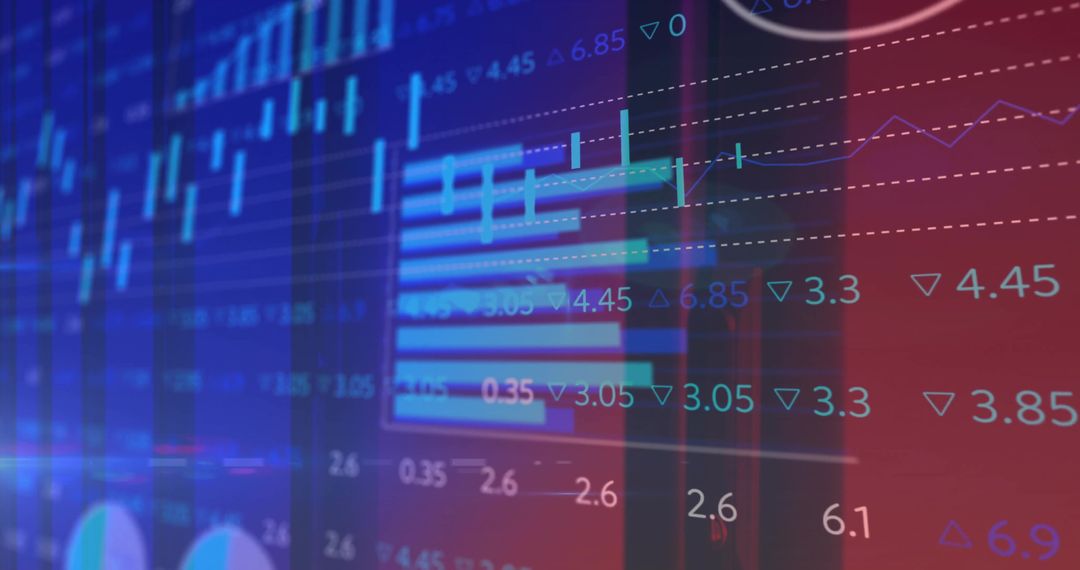
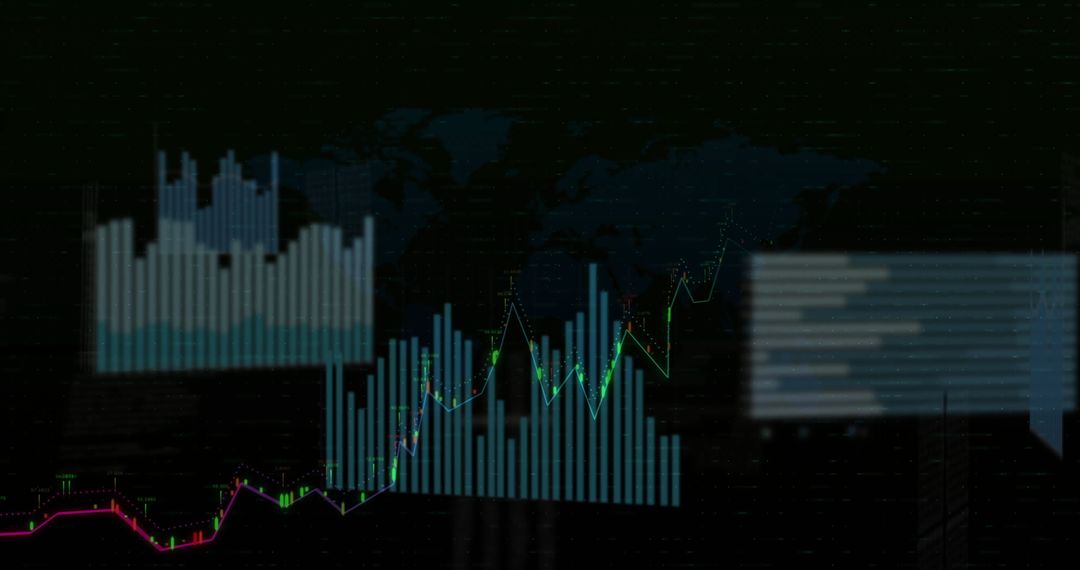
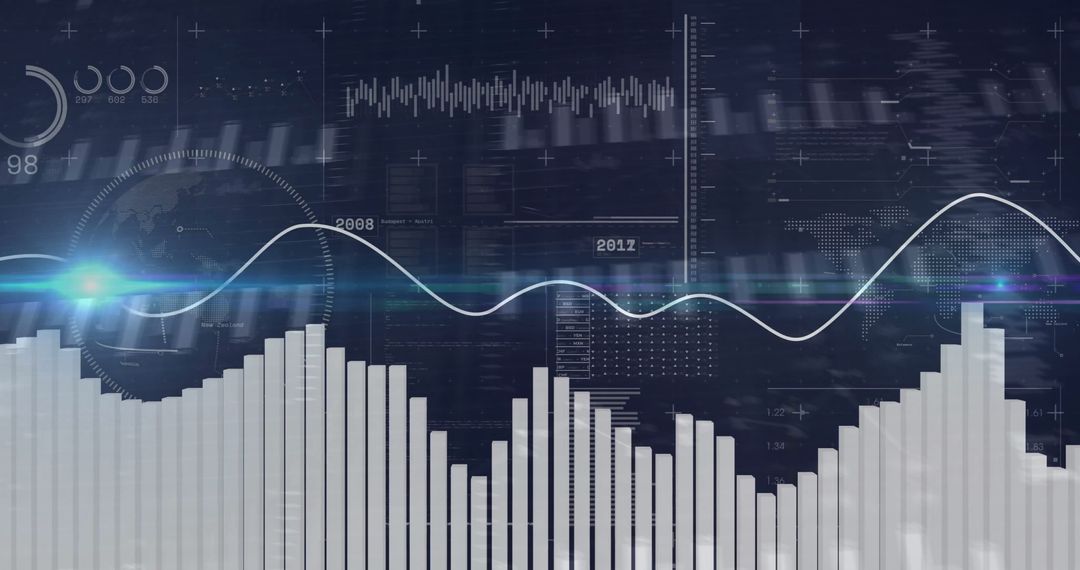
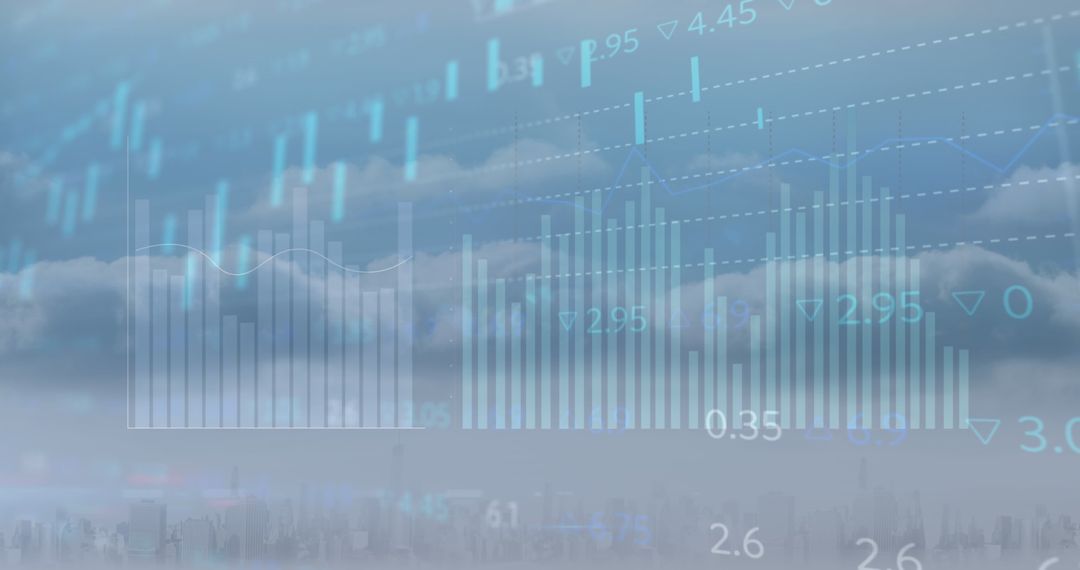
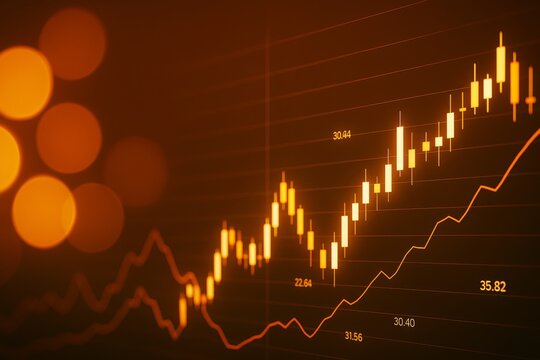
- Digital Finance Data and Statistical Graphs on Dark Background
Digital Finance Data and Statistical Graphs on Dark Background Image

This visually dynamic digital composition of finance-related graphs and data is ideal for use in presentations and reports concerning economic analysis, financial forecasting, or business strategy. Its modern aesthetic makes it suitable for technology or finance industry websites and publications looking to communicate sophistication and advanced data capabilities.
Powered by 


2
downloads
downloads
Tags:
More
Credit Photo
If you would like to credit the Photo, here are some ways you can do so
Text Link
photo Link
<span class="text-link">
<span>
<a target="_blank" href=https://pikwizard.com/photo/digital-finance-data-and-statistical-graphs-on-dark-background/ecd326b7c02eb64258a19dc663f6b0cf/>PikWizard</a>
</span>
</span>
<span class="image-link">
<span
style="margin: 0 0 20px 0; display: inline-block; vertical-align: middle; width: 100%;"
>
<a
target="_blank"
href="https://pikwizard.com/photo/digital-finance-data-and-statistical-graphs-on-dark-background/ecd326b7c02eb64258a19dc663f6b0cf/"
style="text-decoration: none; font-size: 10px; margin: 0;"
>
<img src="https://pikwizard.com/pw/medium/ecd326b7c02eb64258a19dc663f6b0cf.jpg" style="margin: 0; width: 100%;" alt="" />
<p style="font-size: 12px; margin: 0;">PikWizard</p>
</a>
</span>
</span>
Free (free of charge)
Free for personal and commercial use.
Author: Creative Art
Similar Free Stock Images

Premium


Premium


Premium


Premium


Premium


Premium


Premium


Premium


Premium


Premium


Premium


Premium


Premium


Premium


Premium


Premium


Premium


Premium


Premium


Premium


Premium


Premium


Premium


Premium