
- Home >
- Stock Photos >
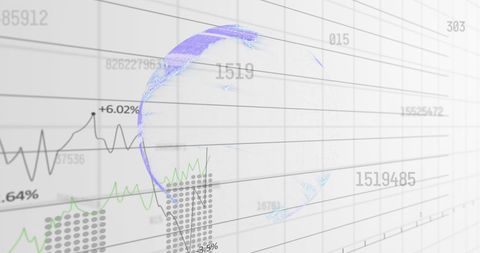
- Digital Finance Data Display with Digital Interface
Digital Finance Data Display with Digital Interface Image

This representation of financial data superimposed on a digital grid can be used in materials related to finance, technology, and global markets. Ideal for illustrating analysis, stock reports, or economic forecasts.
Powered by 


downloads
Tags:
More
Credit Photo
If you would like to credit the Photo, here are some ways you can do so
Text Link
photo Link
<span class="text-link">
<span>
<a target="_blank" href=https://pikwizard.com/photo/digital-finance-data-display-with-digital-interface/6fc6ab6c9741664fe1f0e3db76bf4201/>PikWizard</a>
</span>
</span>
<span class="image-link">
<span
style="margin: 0 0 20px 0; display: inline-block; vertical-align: middle; width: 100%;"
>
<a
target="_blank"
href="https://pikwizard.com/photo/digital-finance-data-display-with-digital-interface/6fc6ab6c9741664fe1f0e3db76bf4201/"
style="text-decoration: none; font-size: 10px; margin: 0;"
>
<img src="https://pikwizard.com/pw/medium/6fc6ab6c9741664fe1f0e3db76bf4201.jpg" style="margin: 0; width: 100%;" alt="" />
<p style="font-size: 12px; margin: 0;">PikWizard</p>
</a>
</span>
</span>
Free (free of charge)
Free for personal and commercial use.
Author: Creative Art
Similar Free Stock Images

Premium


Premium

Premium


Premium


Premium


Premium


Premium


Premium


Premium


Premium


Premium


Premium


Premium

Premium


Premium


Premium

Premium


Premium


Premium

Premium


Premium


Premium


Premium

Premium


Premium


Explore More Free Stock Images