1. Home > 
  2. Stock Photos > 
  3. Digital Finance Graphs Depicting Global Financial Trends

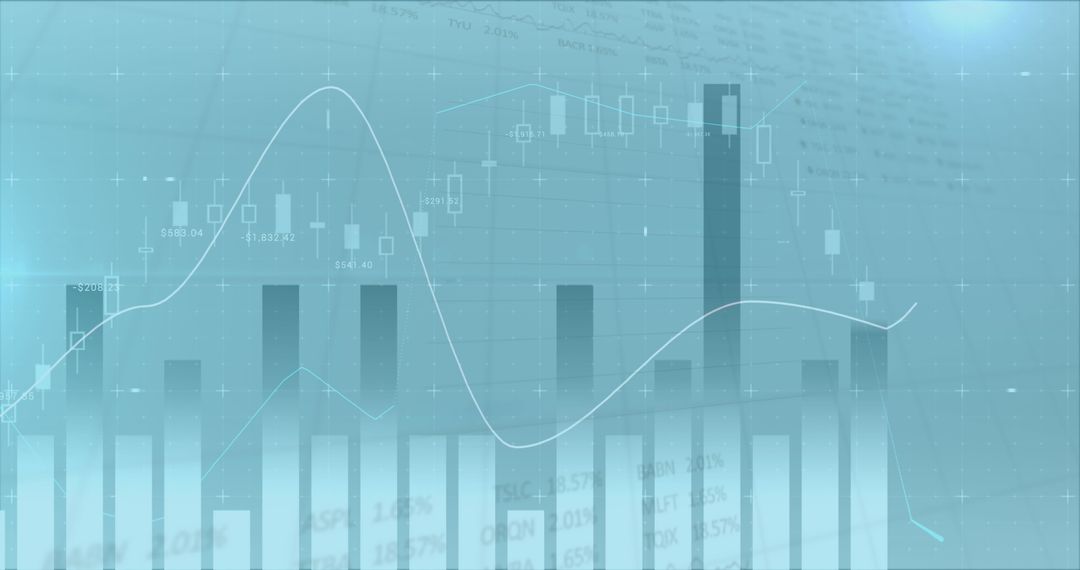
Digital Finance Graphs Depicting Global Financial Trends Image

Digital Finance Graphs Depicting Global Financial Trends

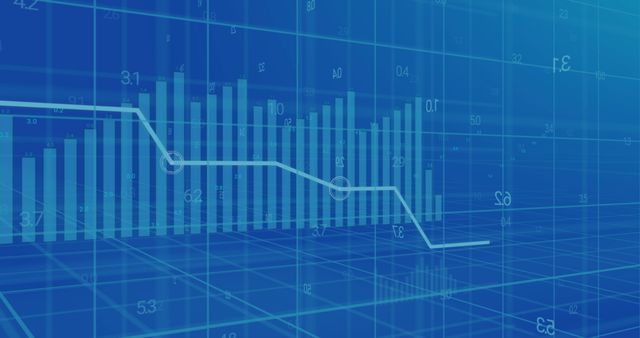
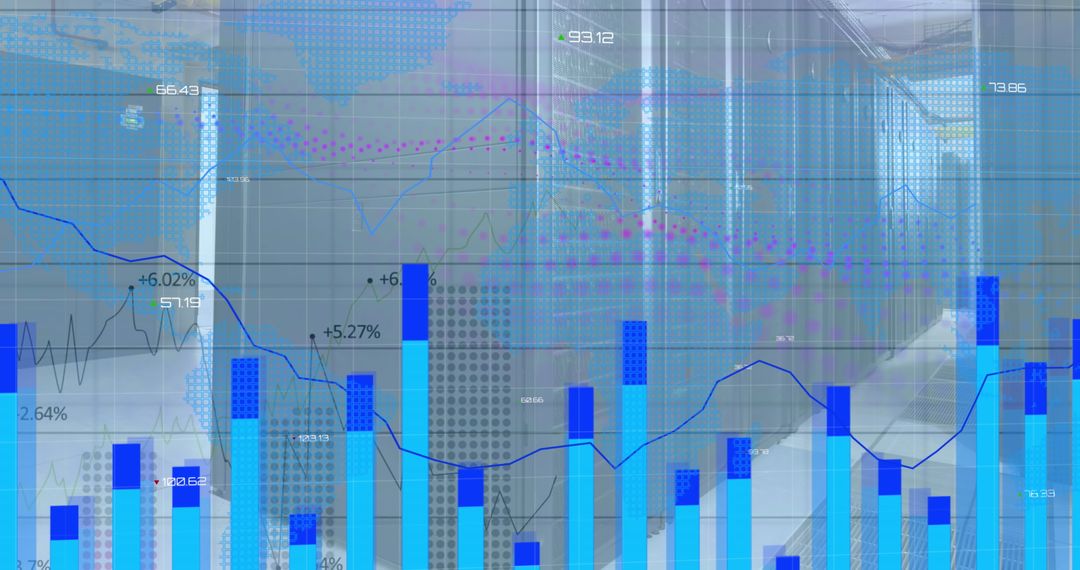
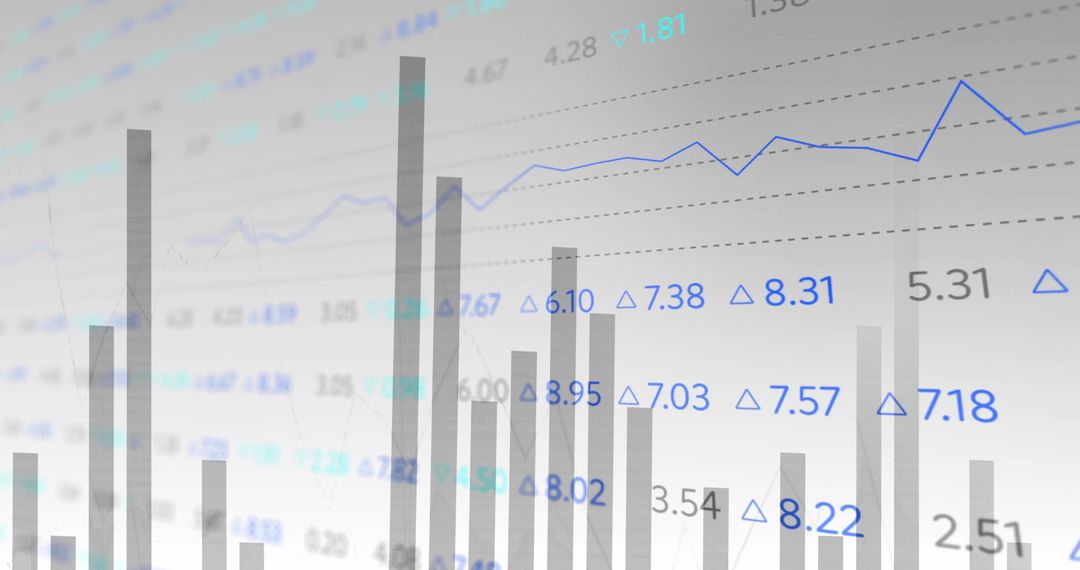
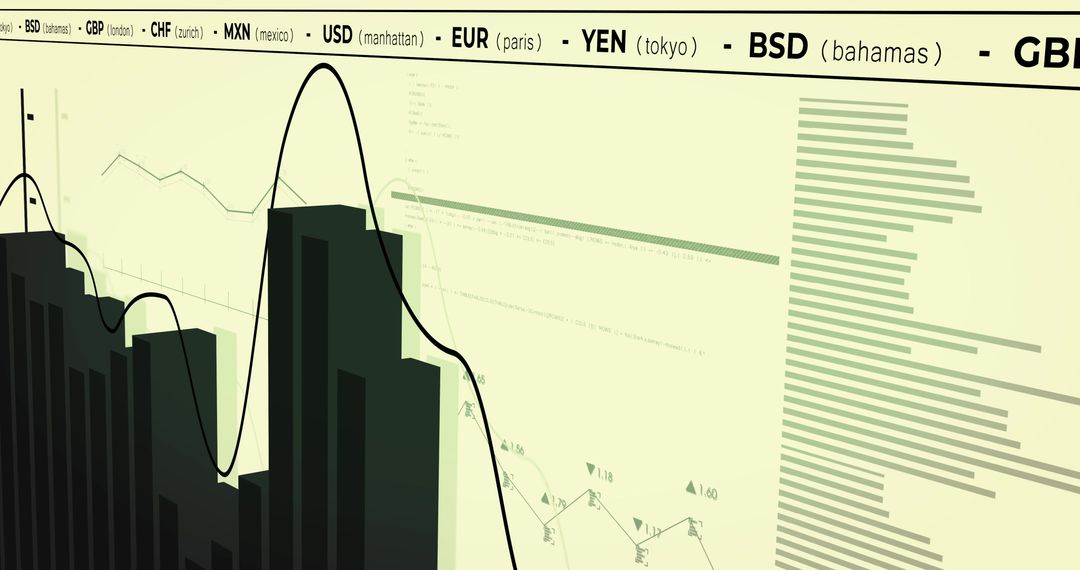
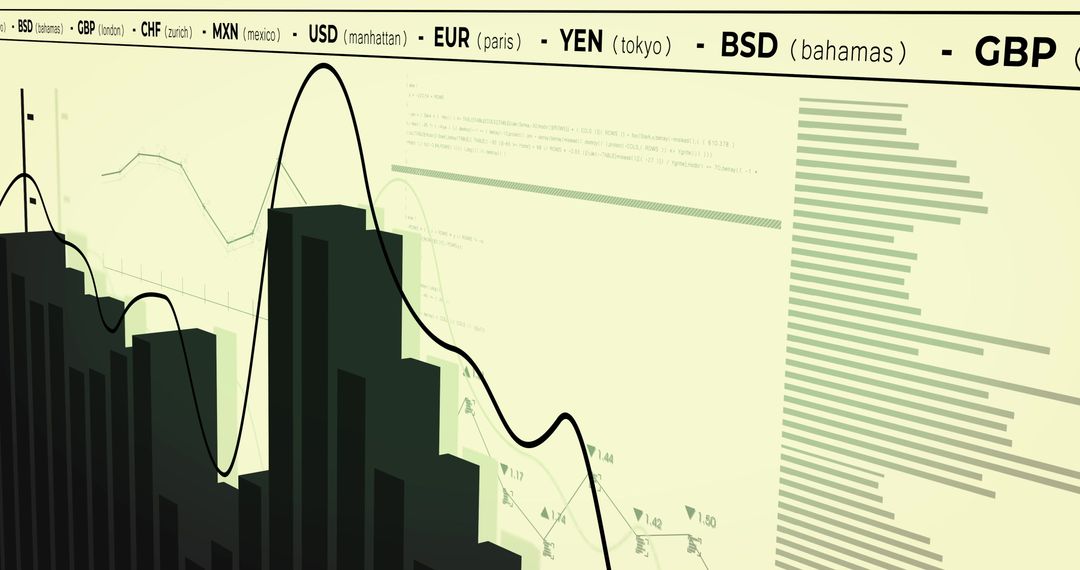
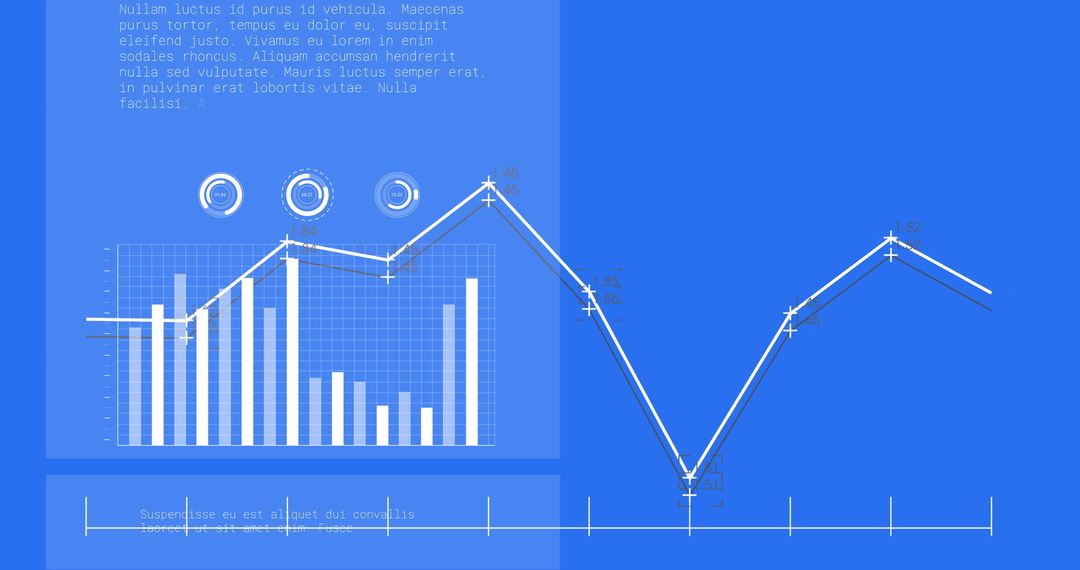
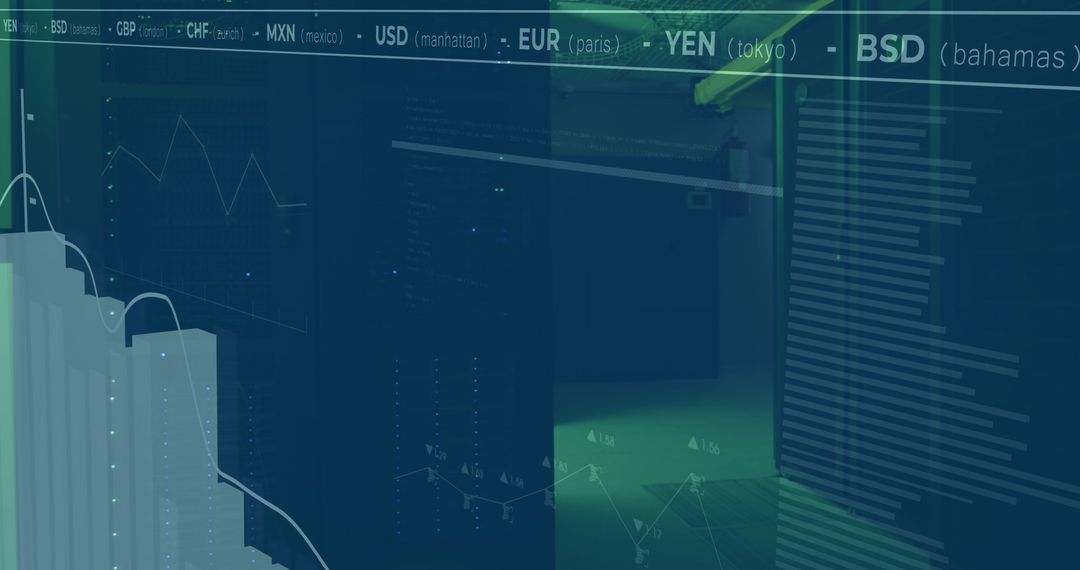
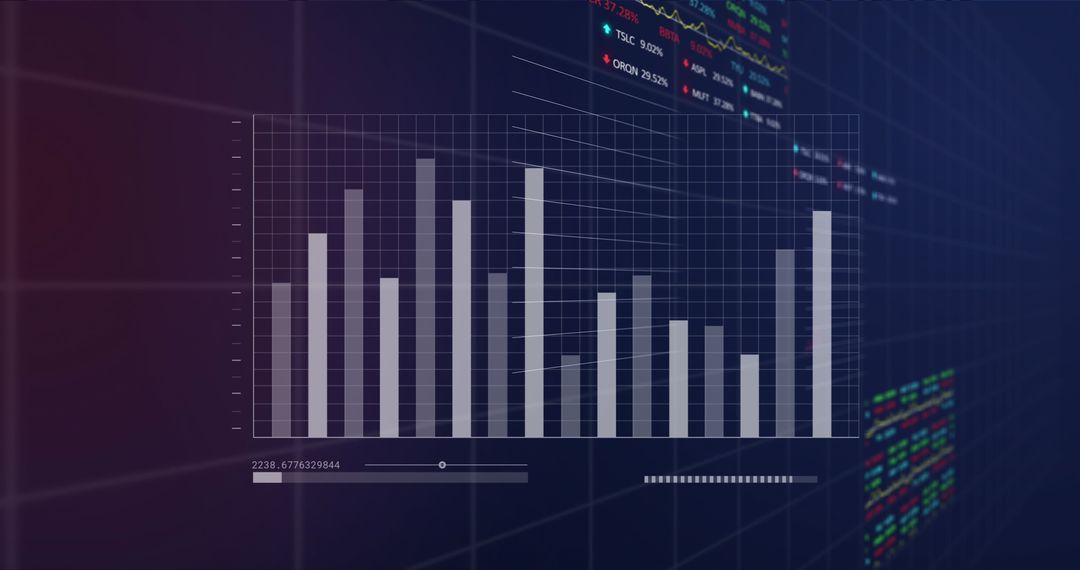
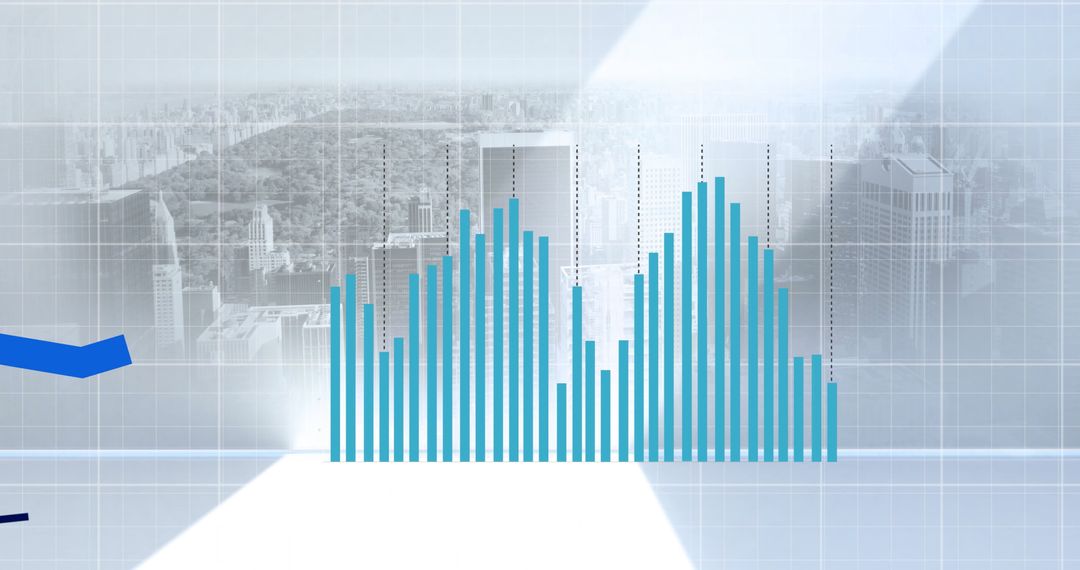
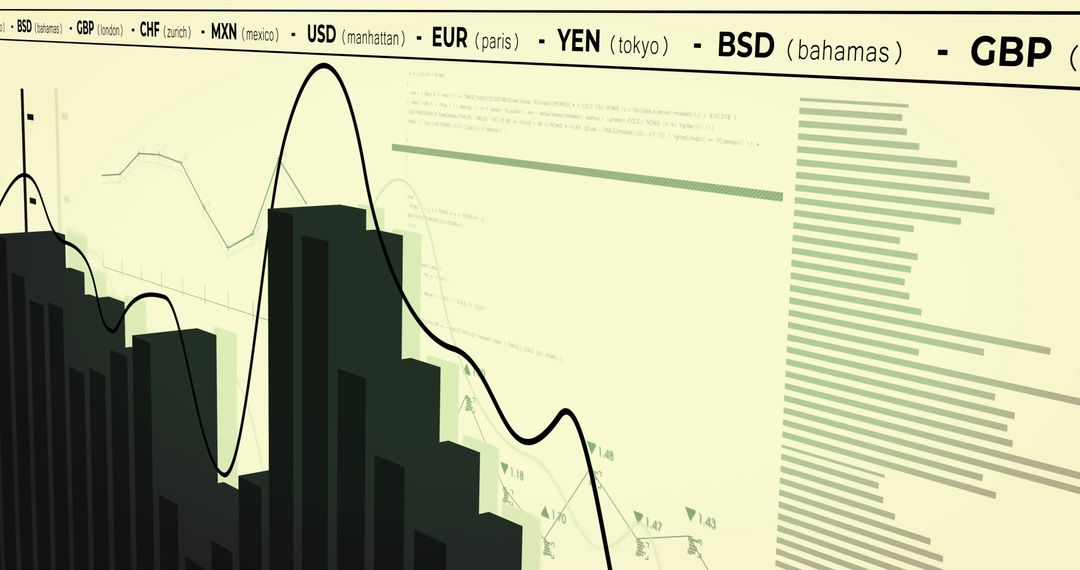
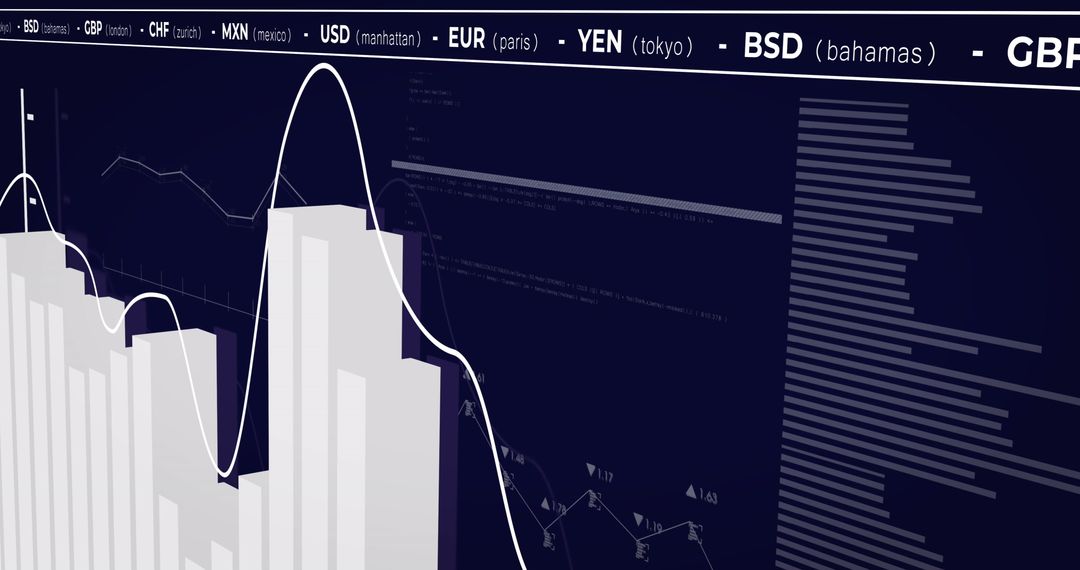
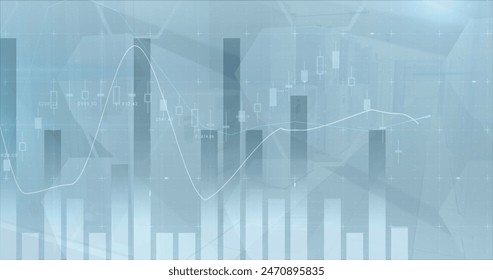
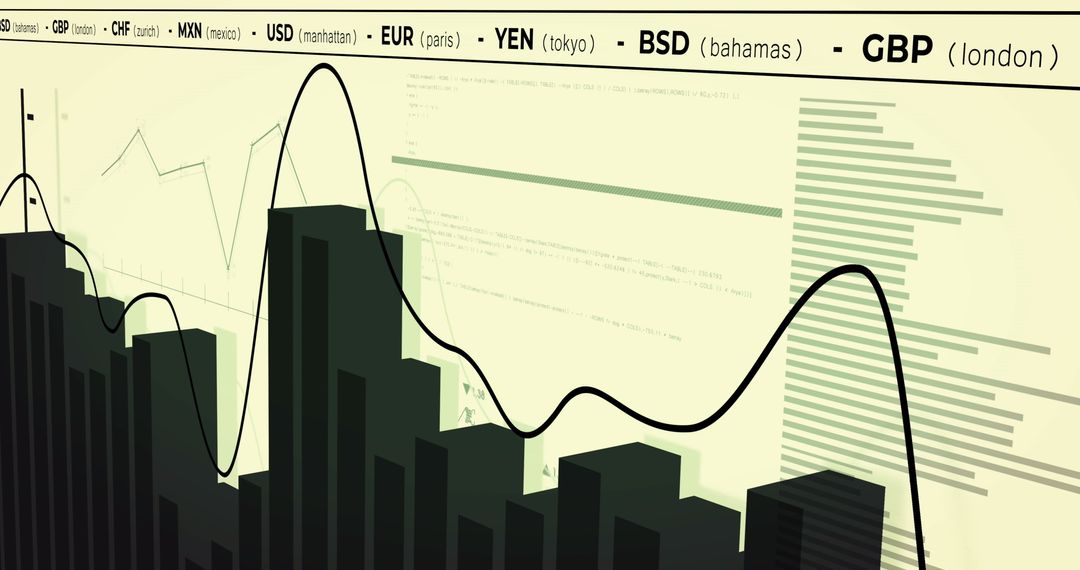
This illustration showcases a digital interface with financial graphs over a blue background. Representing implications of statistical analysis on financial trends, it is perfect for use in business presentations, financial reports, or articles that discuss market analysis or economic indicators. Suitable for anyone seeking theoretical analysis or visualization in the realm of global finance.

Powered by Shutterstock logo - Get 15% off with code: PIKWIZARD15
Abstract glowing big data forex candlestick chart on blurry city backdrop. Trade, technology, investment and analysis concept. Double exposure - Powered by Shutterstock - Get 15% off with code: PIKWIZARD15Internet cyberspace data information collection analytical statistics computer storage ai artificial intelligence calculation, blue background banner copyspace. - Powered by Shutterstock - Get 15% off with code: PIKWIZARD15abstract Financial chart with moving up growing stock market graph in blue light color background - Powered by Shutterstock - Get 15% off with code: PIKWIZARD15Stock market or forex trading graph in futuristic concept suitable for financial investment or Economic trends business idea and all art work design. Abstract finance background - Powered by Shutterstock - Get 15% off with code: PIKWIZARD15Business chart with uptrend line graph, bar chart and stock numbers in bull market on white and blue color background (vector) - Powered by Shutterstock - Get 15% off with code: PIKWIZARD15

Credit Photo

If you would like to credit the Photo, here are some ways you can do so

Free (free of charge)

Free for personal and commercial use.

Author: Awesome Content

Similar Free Stock Images

Digital Stock Market Data with Graphs and Binary Code
Premium
Business man holding tablet and showing holographic graphs and stock market statistics gain profits. Concept of growth planning and business strategy. Display of good economy form digital screen.
Global Financial Data Processing Illustration on Yellow
Financial Data Processing with Global Currency Indicators
Financial Market Trends on Russian Flag Background
Digital Data Visualization Merging with Urban Cityscape
Premium
Businessman using futuristic user interface with virtual data analytics. Innovative dashboard with financial charts, graphs, and global network information for business intelligence.
Dynamic Green Data Interface with 3D Grid Overlay
Global Business Growth with Statistical Graphs and World Map Background
Financial Data Analytics in a High-Tech Digital Environment
Digital Data and Analytics over Urban Cityscape
Premium
Financial chart with moving up arrow graph in stock market on blue color blurred background
Abstract Cityscape with Blue and Pink Data Graphs Overlay
Financial Data Trend Analysis with Graphs on Green Background
Abstract Financial Graphs and Data Overlaid on Server Room
Financial Data Processing with Complex Graphical Interface
Premium
Stock market or forex trading graph in futuristic concept suitable for financial investment or Economic trends business idea and all art work design. Abstract finance background
Global Data Analysis with Rising Graphs and World Map
Digital Financial Graph with Numerical Analysis Interface
Financial Analysis and Team Discussion Overlaid with Data Graphics
Digital Composite of Currency and Financial Graphs in Data Center
Premium
Stock Market Chart on Blue Background. share drop down
Digital Financial Data with Declining Graph
Stock Market Analysis with Charts and Graphs Indicating Trends
Financial Growth Trends with Dynamic Statistical Charts
Dynamic Stock Market Graph Fluctuating in Modern Office
Premium
corona virus vaccine syringe and microscope with graph of stock market in medical health science business blue banner background
Abstract Digital Business Finance Graphs and Server Room Interface
Bar and Line Charts with Stock Market Data Reflecting Financial Analysis
Data Processing Overlaid on Dynamic Global Map with Graphs
Global Financial Decline Visualization on World Map
Digital Decline in Finance Graph with Red Downward Arrow
Financial Data Processing in Digital Global Interface Concept
Premium
Financial chart with moving up stock market graph in neon light color background
Financial Charts with Upward Trend and Analysis Tools
Financial Data Visualization and Digital Analysis with World Map
Global Cryptocurrency Market Trends and Financial Data Visualization
Global Data Visualization Over Evening City Skyline
Premium
Display of quotes pricing graph visualization.  Financial statistic analysis on dark background with growing financial charts. Stock analyzing. Price chart bars.
Digital Financial Data Analysis with Grid Overlay
Digital Gold Bullions and Financial Data Analysis Concept
Digital Faces on Data Grid Illustrating Analytics and Security
Trending Data and Finance Insights on Digital Grid Background
Premium
Double exposure of New York skyline and stock market charts, representing a concept of urban finance and investment. Double exposure
Financial Downturn Illustrated by Descending Red Arrow and Data
Digital Graph and Statistics Overlay on Shipyard Background
3D Graph Bar Growing with City Skyline Background
Futuristic Digital Graphics Over Urban Cityscape
Premium
Financial data on a monitor. Finance data concept. stock market pricing abstract. Business background. Market Analyze.Bar graphs, diagrams, financial figures. Forex.
Financial Growth Graph Over Urban Skyline with Currencies
Data Processing with Financial Graphs and Analytics
Animated Financial Chart Depicting Stock Market Trends
Abstract Financial Graph Showing Digital Market Trends
Premium
Internet cyberspace internet data collection analytical computer ai artificial intelligence calculation, blue background banner copyspace.
Abstract Stock Market and Data Analysis in Purple Hue
Financial Charts Overlaid with Data and Trends in Abstract Display
Dynamic Financial Data Overlaid on Digital Grid
Digital Finance Data and Statistical Graphs on Dark Background
Premium
Financial accounting of profit summary graphs analysis. The business plan at the meeting and analyze financial numbers to view the performance of the company in stock market exchange.
Cybersecurity Analytics: Data Graph and Digital Lock Interface
Abstract Financial Data with Virtual Cybernetic Overlays
Futuristic 3D Bar Chart with Line Graph in Digital Grid
Downward Trend in Financial Data Analysis Conceptual Illustration
Abstract Financial Data Visualization in Yellow Tones
Financial Data Processing on Digital Screen with Global Currencies
Premium
Stock market graph trading analysis investment financial, stock exchange financial or forex graph stock market graph chart business crisis crash loss and grow up gain and profits win up trend
Abstract Financial Data Chart with Gradient Background
Digital Data Footprint with 6G Network Technology Concept
Financial Graphs on Digital Screen with Circles and Zero Percent Display
Dynamic Financial Data Representation on Purple Gradient
Premium
Two intertwined blue and orange economic growth lines run up a series of coin columns on a reflective black surface against a dark blue background
Digital Interface of Global Data and Statistics on Blue Background
Futuristic Financial Analytics with Data Charts and Graphs
Digital Data Visualization with 3D Bar Graph
Digital Data Graph Overlaying Urban Cityscape
Premium
A magnifying glass over a financial chart, illustrating market analysis and business concepts, in blue light against a dark background.
Digital Analytics Overlaying City Skyline With Data Points
Abstract Data Visualization with Bar and Line Graphs on Network Grid
Futuristic Digital City Overlay on Data Matrix Background
Abstract Financial Data and Analytics Visualization
Premium
Display stock market numbers with defocused street lights background
Financial Data Signals Overlaid on Online Data Security Center
Digital Graphs and Trading Data Visualization in Dark Composition
Futuristic Data Grid Interface Display with Analytical Charts
Statistical Data Processing Interface with Blue Background
Premium
Businessman forex trader using tablet technology indicating rising trend growth in the market, analyzing financial data buying stock exchange currency, crypto forex stock market blue banner background
Abstract Display of Financial Graphs and Data Visualization
Data Processing Visualization with Digital Charts on Blue Background
Financial Data Analysis in Server Environment
Binary Code and Growing Bar Graph on Dark Digital Background
Premium
Financial stock market. Abstract financial chart with graph and stack of coins in Double exposure style background. Growing business graph with rising up trend
Digital Interface with Blue Bar Graphs Over Cityscape
Global Financial Data Dashboard Showing Interactive Bar Charts, Line Trends, and World Map
Digital Data Graph Overlays on Urban Cityscape
Global Financial Data Analysis with Currency Graphs
Global Financial Market Trends with Currency Exchange Rates
Global Stock Market and Statistical Data Visualization
Premium
Blue and white background displaying graphs and data points. Showing financial analysis or market trends in technology sector
Data Processing and Analytics Over Cityscape at Night
Financial Chart Analysis and Data Visualization Concept
Abstract Financial Graph Display on Dark Background
Innovative Financial Data Visualization with Urban Backdrop
Premium
Histogram and lines economic chart on modern architecture background
Pink Graph and Data Analysis on 3D Grid for Financial Trends
Graph Data Visualization on Blue 3D Grid Design
Data Interface Graph Over Modern Cityscape
Global Financial Data Processing with Digital Analytics
Premium
Stock market graph trading analysis investment financial, stock exchange financial or forex graph stock market graph chart business crisis crash loss and grow up gain and profits win up trend
Digital Interface Displaying Dynamic Financial Data Analysis
Futuristic Data Analytics Interface with Graphics
Futuristic Data Analysis with Digital Graphs and Finance Indicators
Digital Monetary Trending and Analytics in Urban Backdrop
Premium
Stock market or forex trading graph in futuristic concept suitable for financial investment or Economic trends business idea and all art work design. Abstract finance background
Digital Data Interface with Graphs for Business Analysis
Digital Financial Data Visualization with Blue Background
Digital Financial Graphs and Data Visualization on Red Background
Digital Financial Data Visualization Concept with Chart Overlay
Premium
3D blue bar graph rising, sotck market informations
Abstract Financial Data and Charts in Urban City Background
Digital Data Visualization with Global Financial Charts
Digital Charts Displaying Data Analytics in Technology Background
Digital Data Analysis Concept with Graph on Grid Background
Premium
Businessman using tablet analyzing business growth graph data and progress, compass of navigate guiding market direction. Investment, banking and finance, business strategy. Global economy.
Businesswoman presenting teal analytics dashboard with rising bar chart and line graph