
- Home >
- Stock Photos >
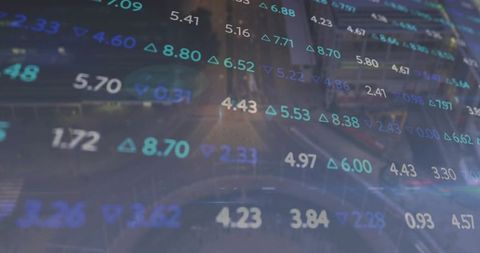
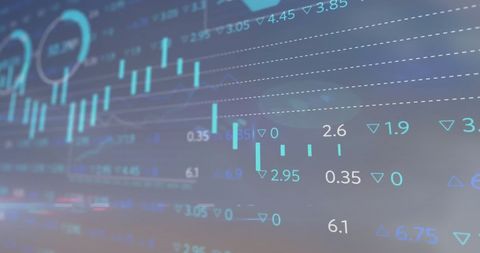
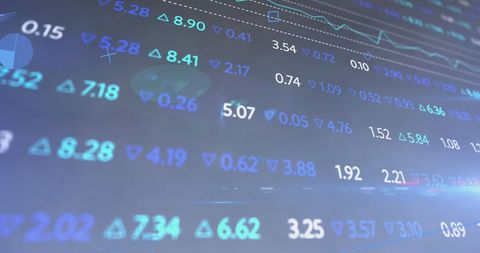
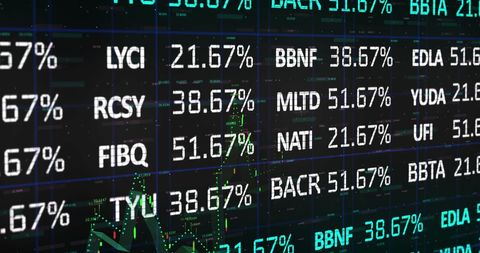
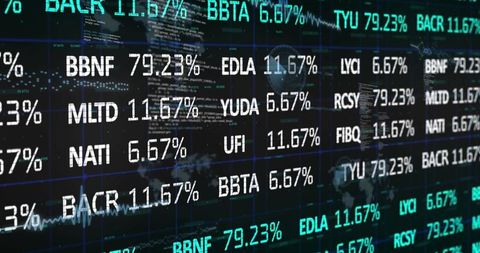
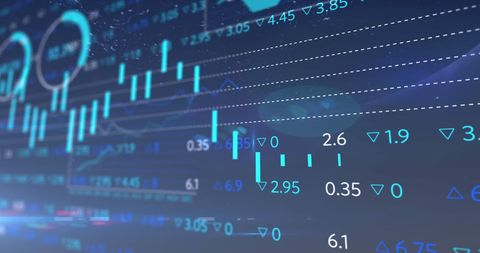
- Digital Finance Interface Displaying Stocks and Data Analytics
Digital Finance Interface Displaying Stocks and Data Analytics Image
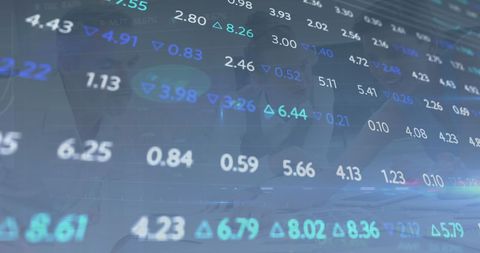
Visual representation of interconnected digital financial data layers and stock exchanges often used to depict modern finance technology, innovation in investment analysis or fintech marketing. Suitable for use in presentations related to stock market trends, business technology, and financial analytics.
Powered by  - Get 15% off with code: PIKWIZARD15


downloads
Tags:
More
Credit Photo
If you would like to credit the Photo, here are some ways you can do so
Text Link
photo Link
<span class="text-link">
<span>
<a target="_blank" href=https://pikwizard.com/photo/digital-finance-interface-displaying-stocks-and-data-analytics/c9f082308afd879f51d7fbdcd5b50c7b/>PikWizard</a>
</span>
</span>
<span class="image-link">
<span
style="margin: 0 0 20px 0; display: inline-block; vertical-align: middle; width: 100%;"
>
<a
target="_blank"
href="https://pikwizard.com/photo/digital-finance-interface-displaying-stocks-and-data-analytics/c9f082308afd879f51d7fbdcd5b50c7b/"
style="text-decoration: none; font-size: 10px; margin: 0;"
>
<img src="https://pikwizard.com/pw/medium/c9f082308afd879f51d7fbdcd5b50c7b.jpg" style="margin: 0; width: 100%;" alt="" />
<p style="font-size: 12px; margin: 0;">PikWizard</p>
</a>
</span>
</span>
Free (free of charge)
Free for personal and commercial use.
Author: Creative Art
Similar Free Stock Images

Premium


Premium


Premium


Premium

Premium


AI


Premium


AI


AI

Premium


AI

Premium


Premium


AI


Premium


Premium

Premium

Premium

Premium

Premium


Premium

Premium


Premium


Premium


Premium


Premium

Premium

Premium

Explore More Free Stock Images