- Home >
- Stock Photos >
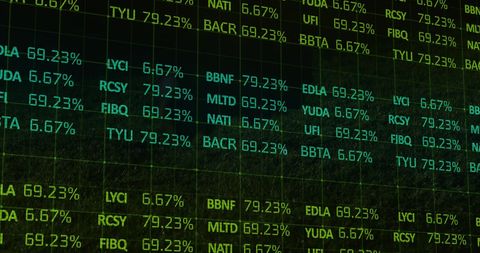
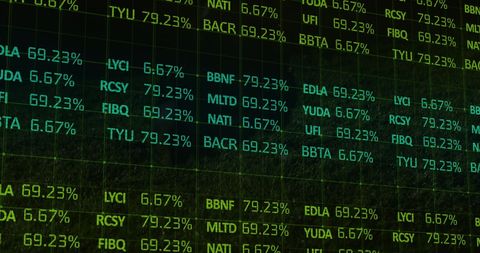
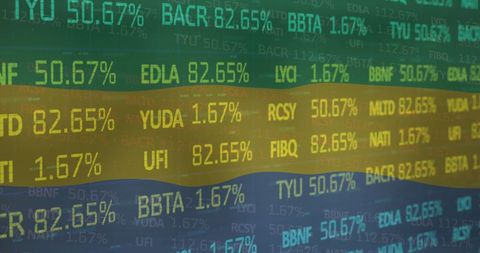
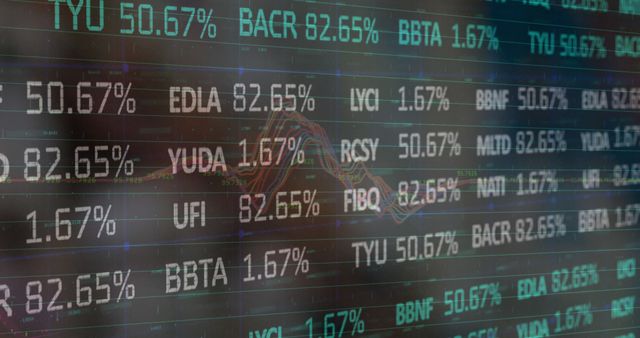
- Digital Finance Interface with Complex Data Connections
Digital Finance Interface with Complex Data Connections Image

Depicts an abstract visualization of financial data with digital and geometric design elements. Illuminated numbers and breaking data nodes convey the idea of a virtual finance system. Ideal for use in technology articles, business forecasts, or illustrating global finance trends.

downloads
Tags:
More
Credit Photo
If you would like to credit the Photo, here are some ways you can do so
Text Link
photo Link
<span class="text-link">
<span>
<a target="_blank" href=https://pikwizard.com/photo/digital-finance-interface-with-complex-data-connections/707866063265a8a5244ab3804739169c/>PikWizard</a>
</span>
</span>
<span class="image-link">
<span
style="margin: 0 0 20px 0; display: inline-block; vertical-align: middle; width: 100%;"
>
<a
target="_blank"
href="https://pikwizard.com/photo/digital-finance-interface-with-complex-data-connections/707866063265a8a5244ab3804739169c/"
style="text-decoration: none; font-size: 10px; margin: 0;"
>
<img src="https://pikwizard.com/pw/medium/707866063265a8a5244ab3804739169c.jpg" style="margin: 0; width: 100%;" alt="" />
<p style="font-size: 12px; margin: 0;">PikWizard</p>
</a>
</span>
</span>
Free (free of charge)
Free for personal and commercial use.
Author: Authentic Images