1. Home > 
  2. Stock Photos > 
  3. Digital Finance Interface with Dynamic Trading Data Displays

Digital Finance Interface with Dynamic Trading Data Displays Image

Digital Finance Interface with Dynamic Trading Data Displays

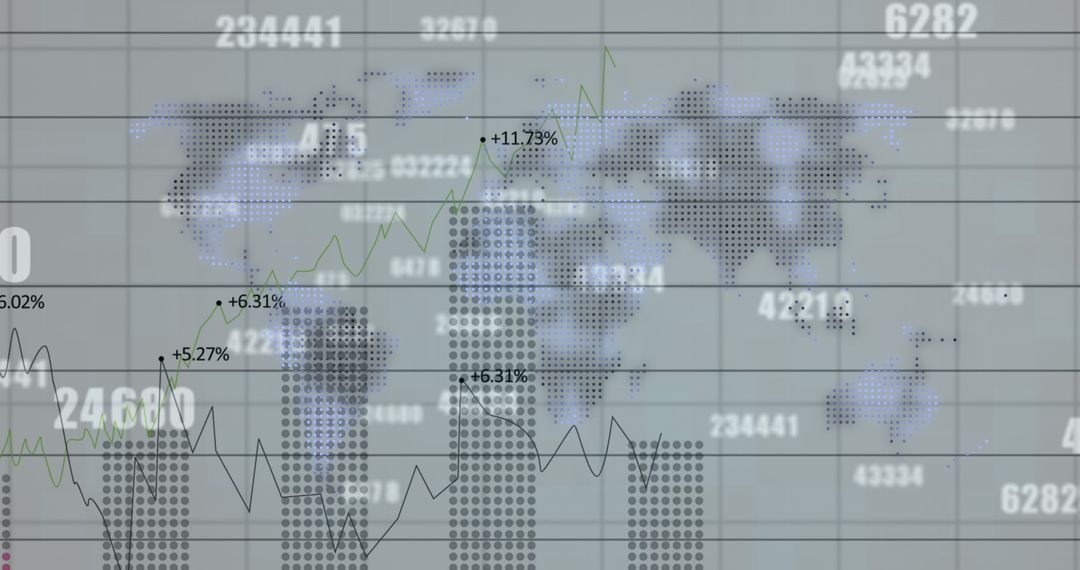
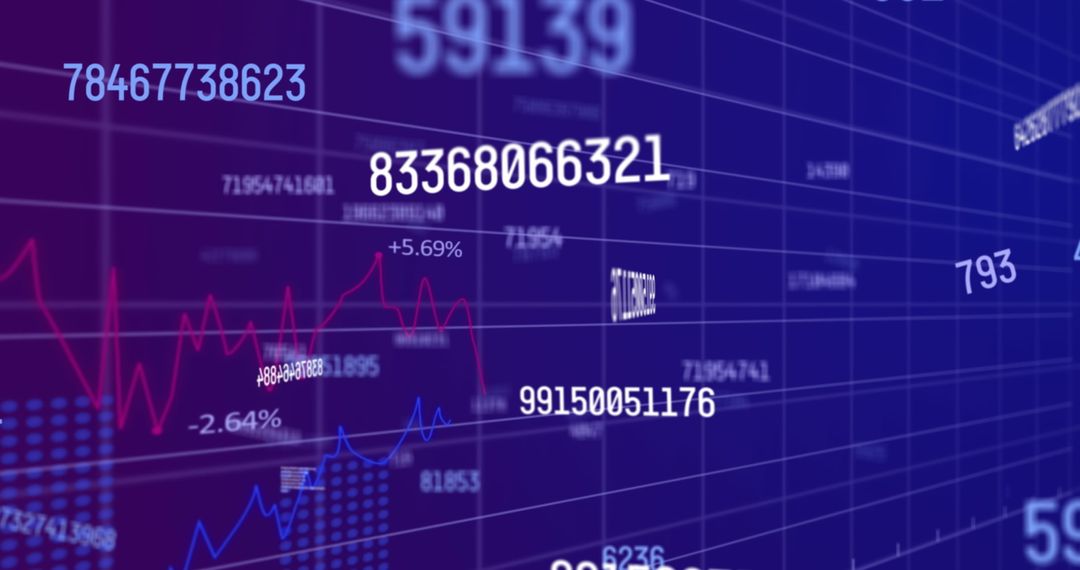
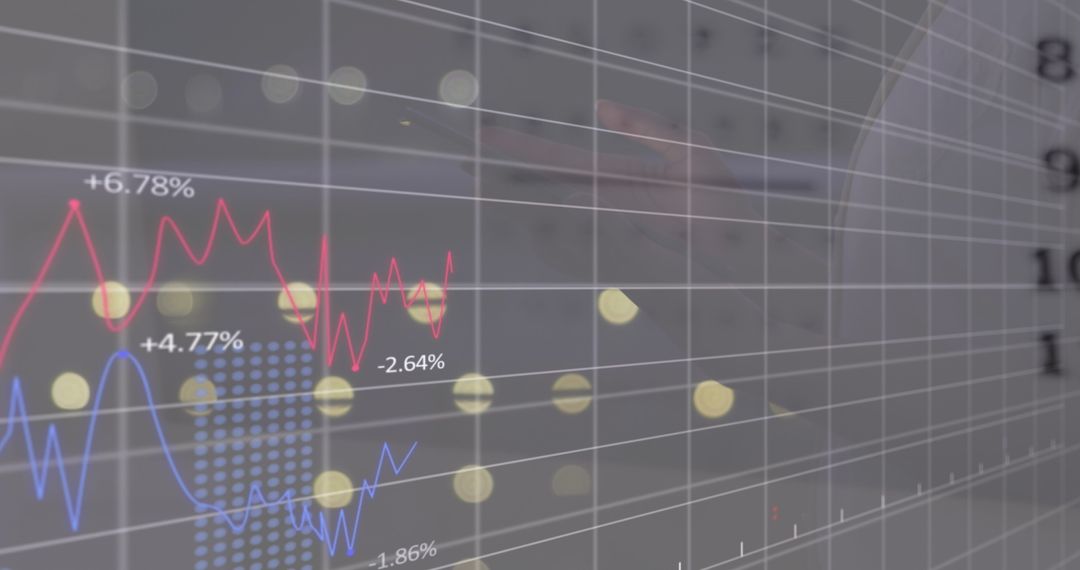
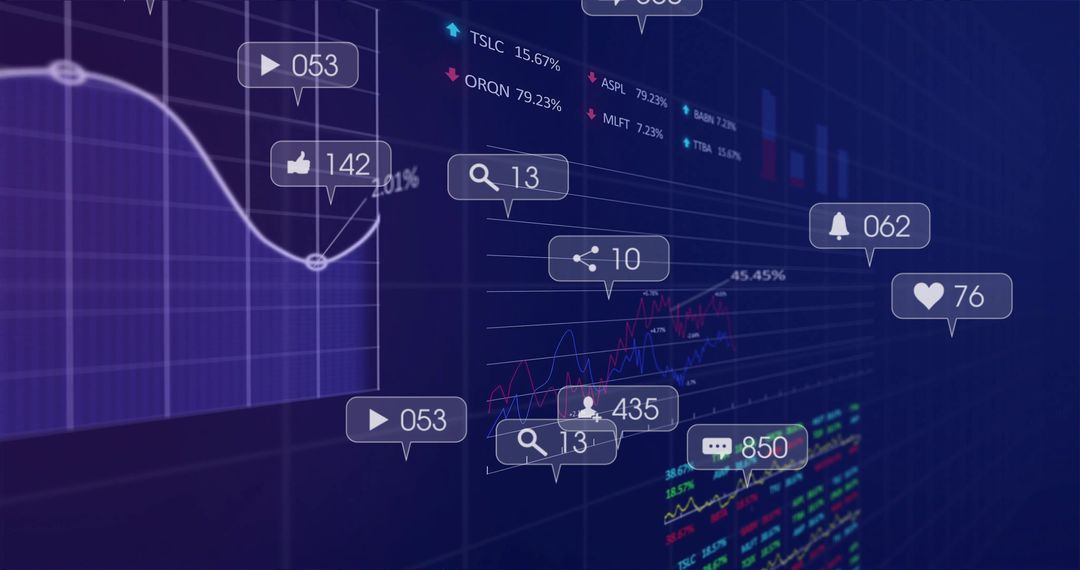
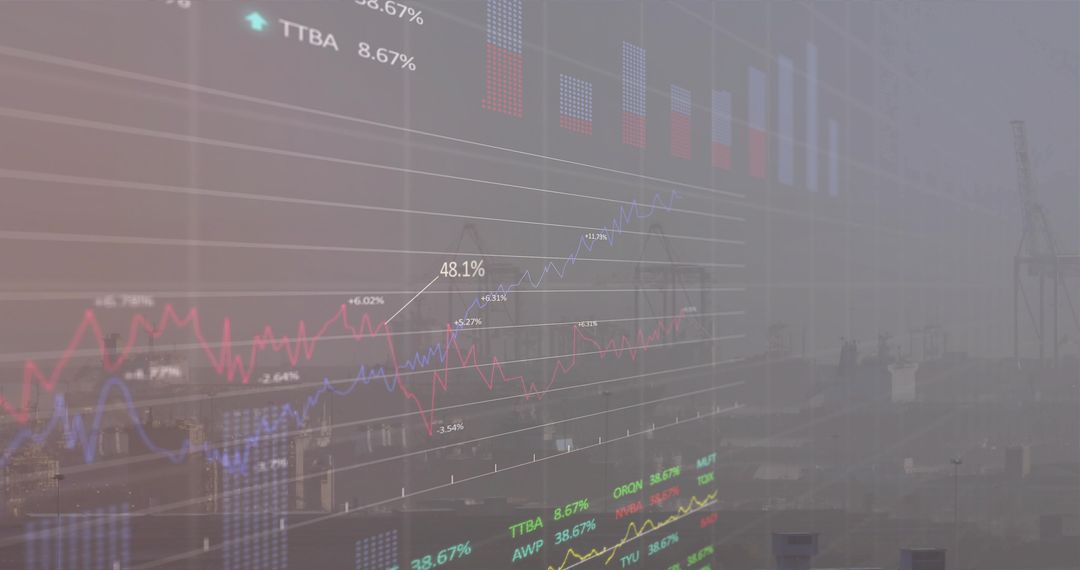
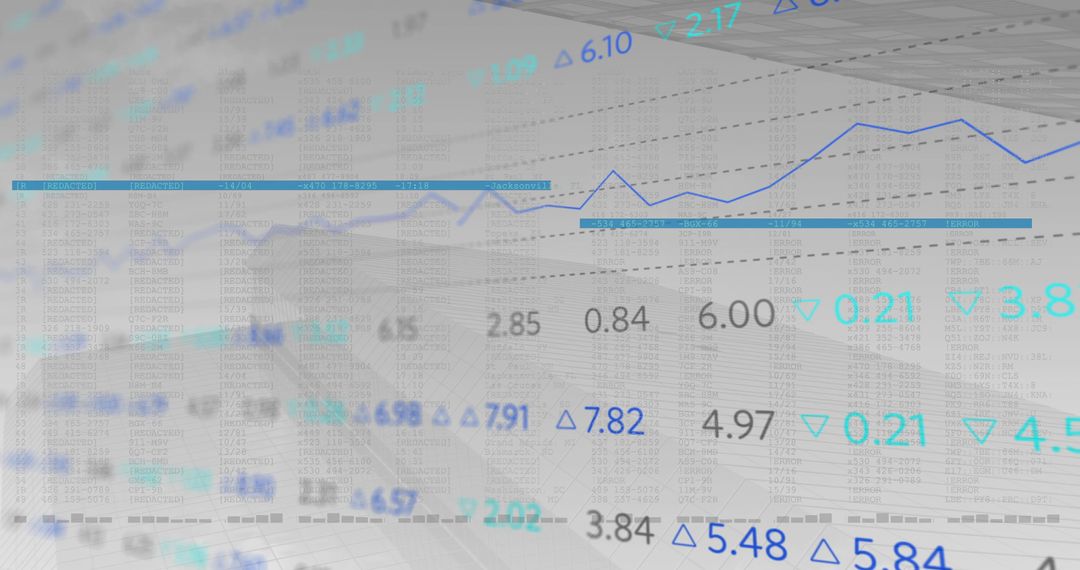
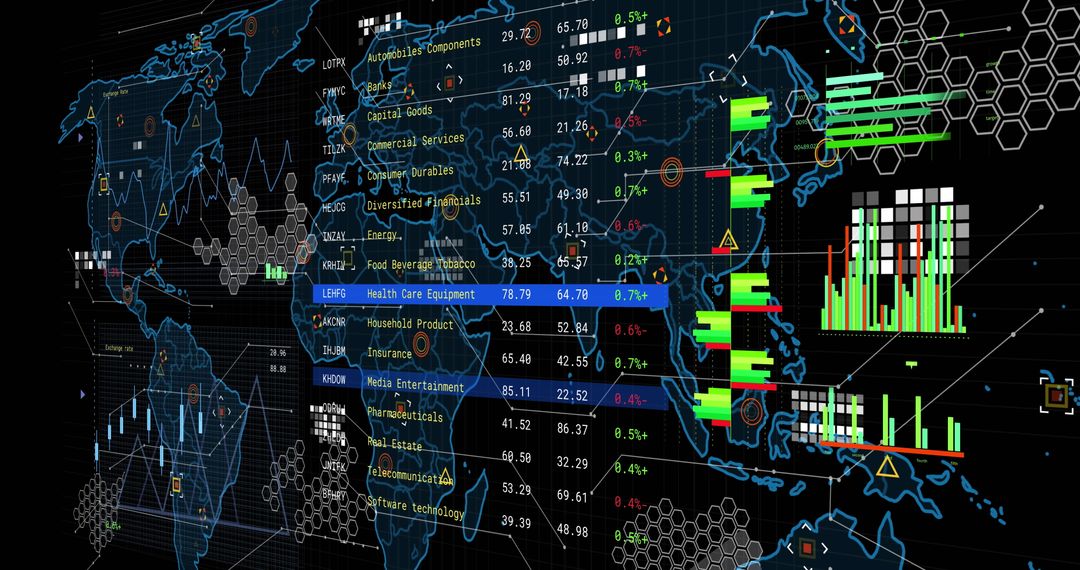
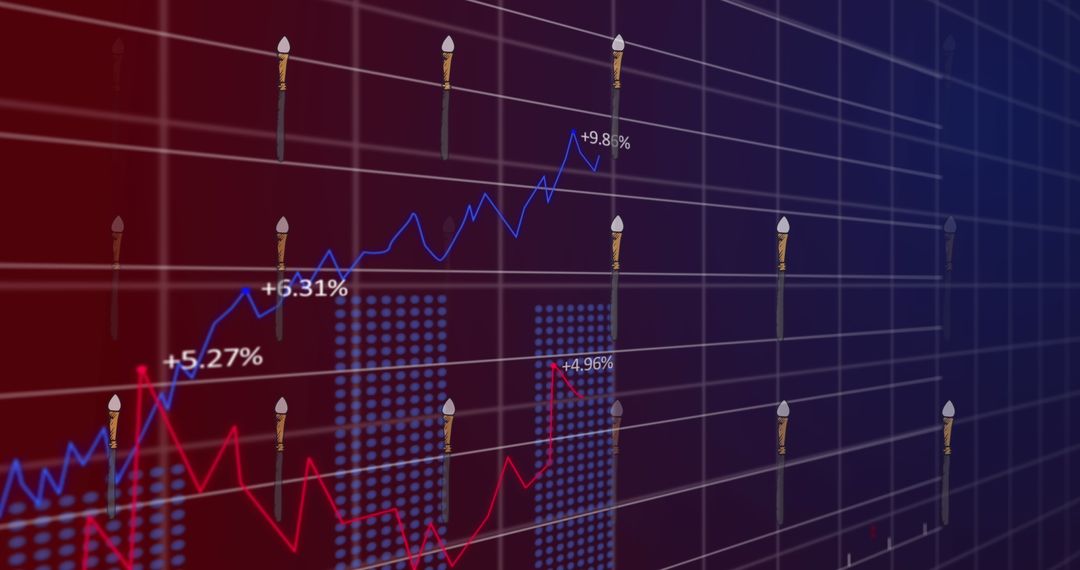
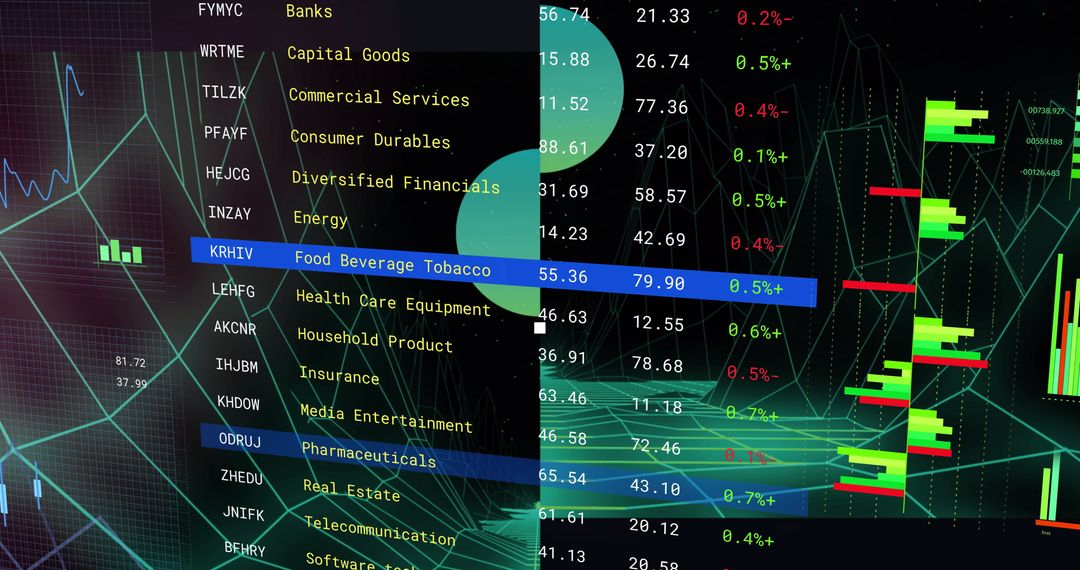
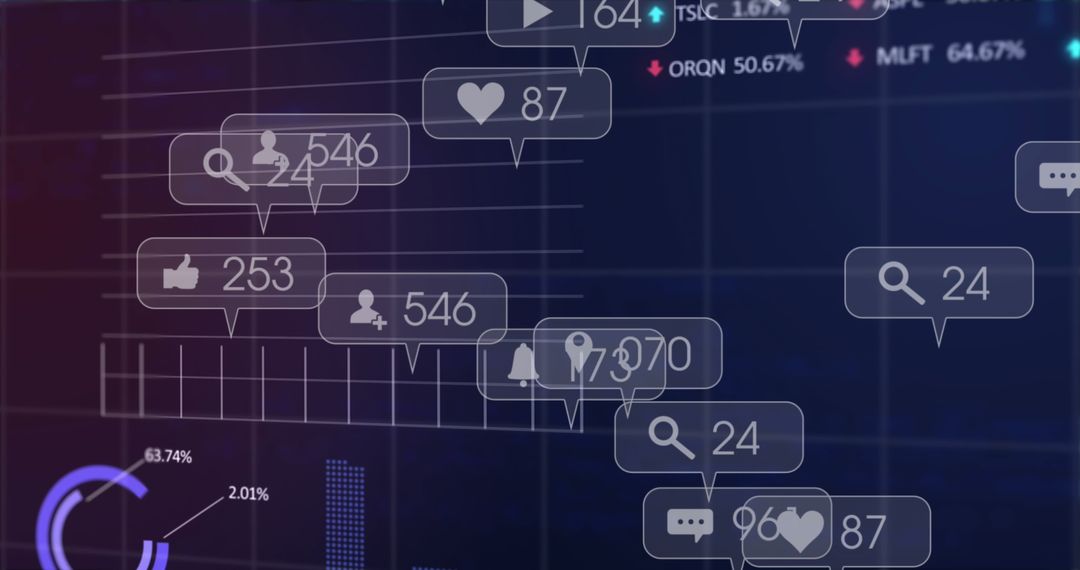
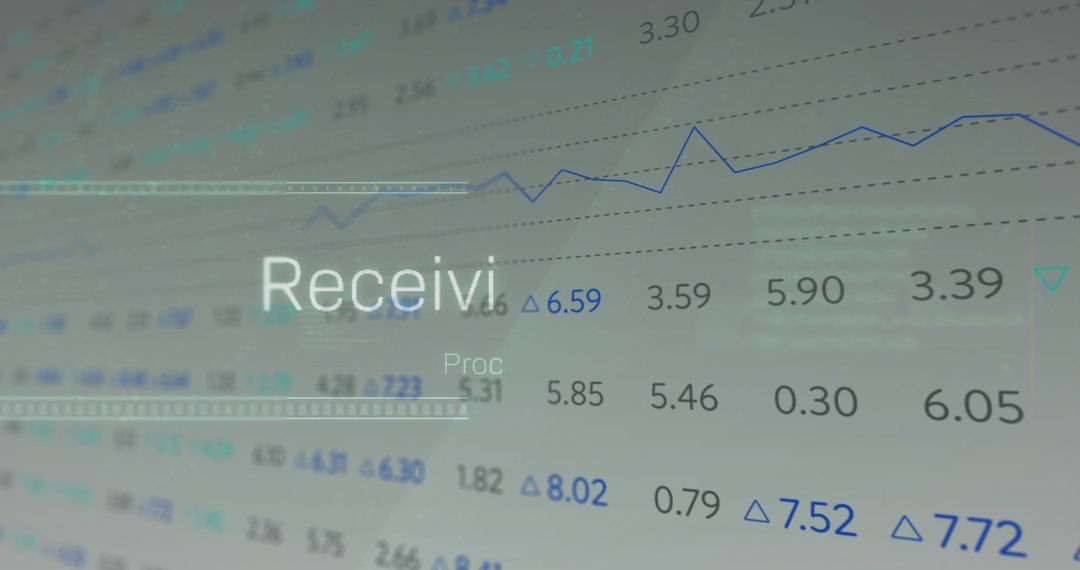
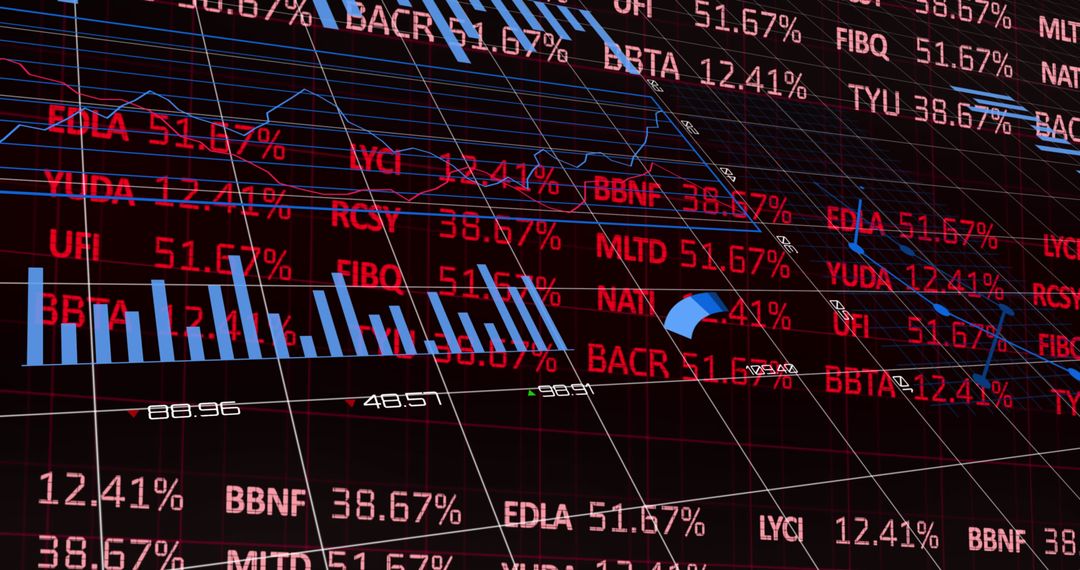
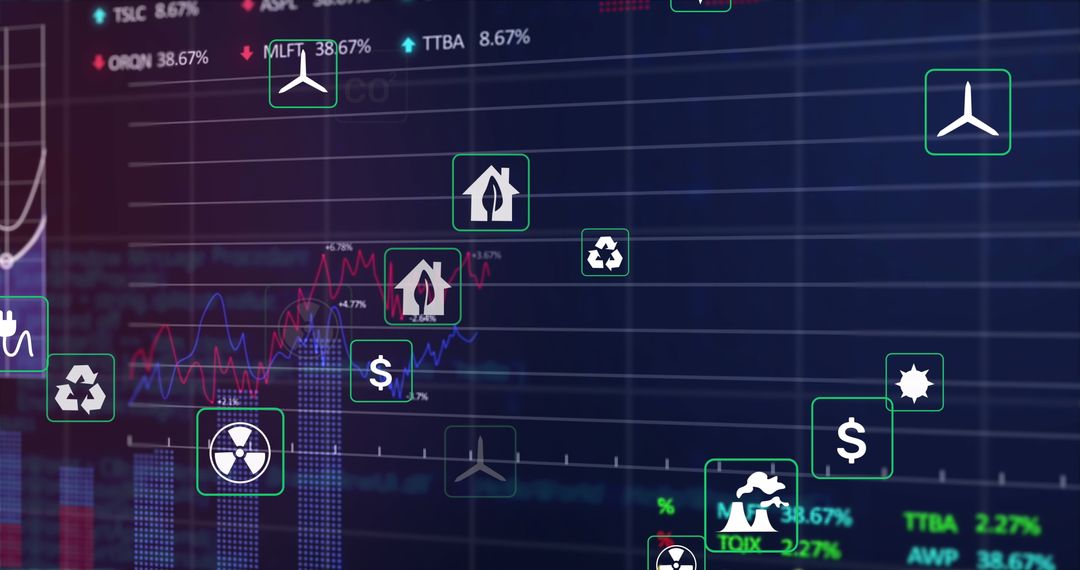
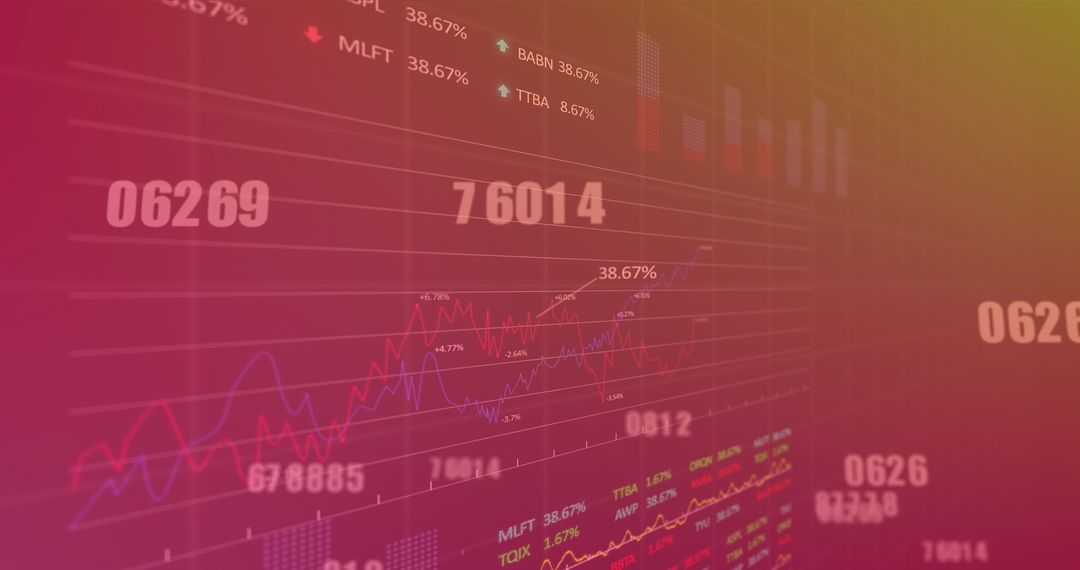
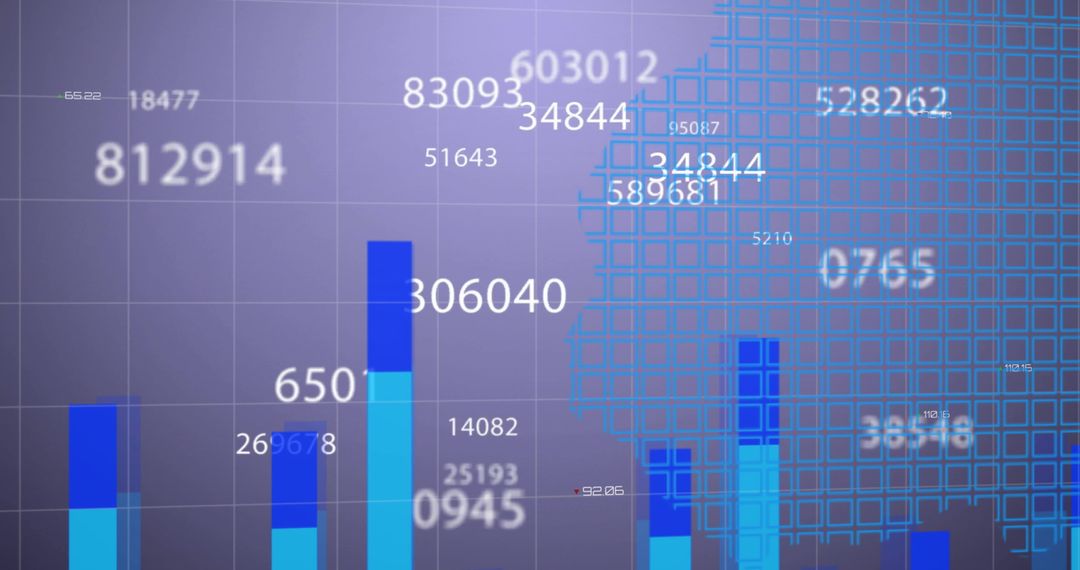
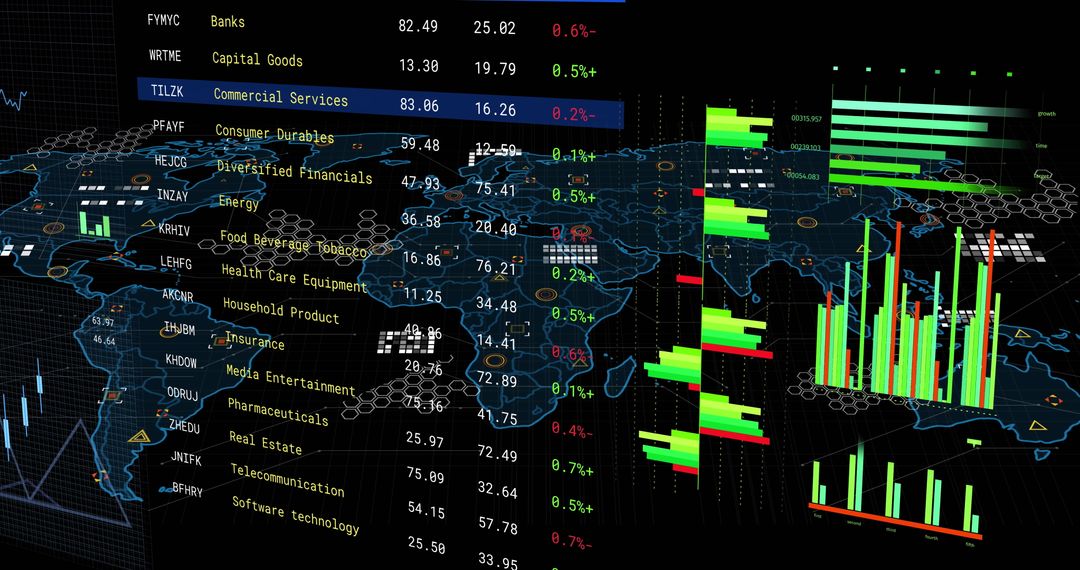
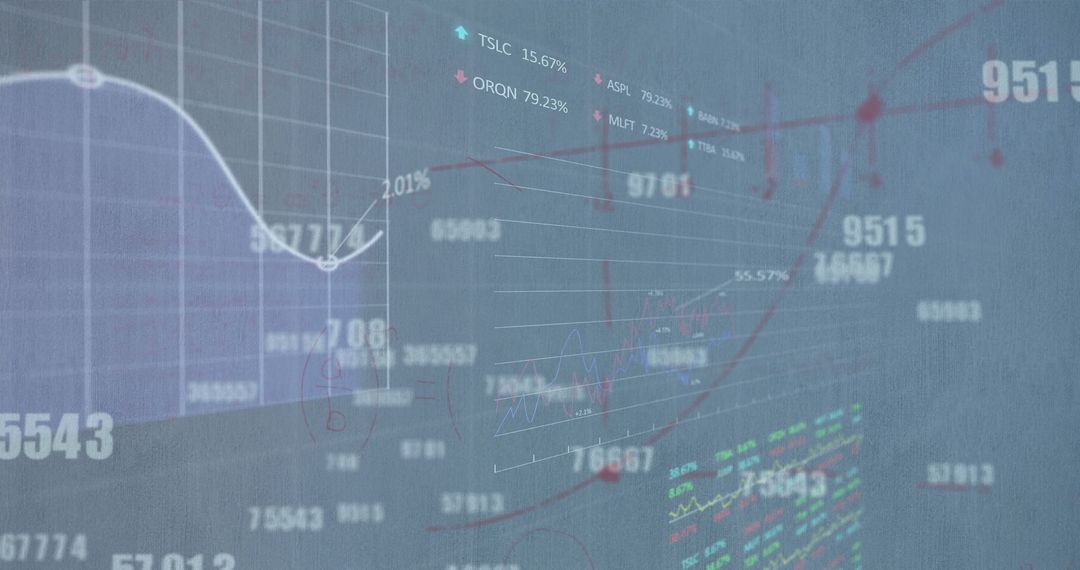
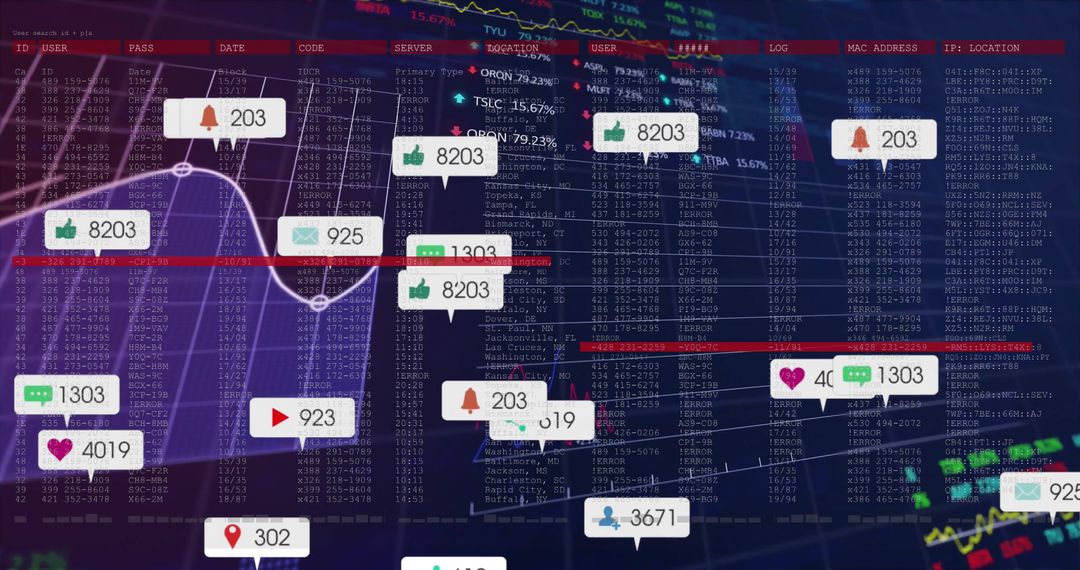
Numbers dynamically changing on a digital interface suggest activity within stock markets or financial trading platforms. Great for illustrating articles on global economy, financial analysis, or the impact of technology on trading. Ideal for banners or presentations that explain online trading, investing, or digital finance tools.

Powered by Shutterstock logo - Get 15% off with code: PIKWIZARD15
Business, finance and investment concept. Businessman using digital tablet analyzing and calculating financial data with economic graph growth chart, Business strategy and planning. market research - Powered by Shutterstock - Get 15% off with code: PIKWIZARD15Analysis finance grow graph and market  investment. Financial  business plan,earnings,sale and strategy. Stock market chart, exchange financial growth diagram. - Powered by Shutterstock - Get 15% off with code: PIKWIZARD15Stock market analysis, business, finance and investment. Finance analyst analyzing stock market trading graph, economic growth chart, planning and strategy, business investment with financial report - Powered by Shutterstock - Get 15% off with code: PIKWIZARD15Financial advisor explaining invest stock market data consulting investor. Two busy business men analysts doing finance trading analysis pointing at exchange chart on laptop screen working in office. - Powered by Shutterstock - Get 15% off with code: PIKWIZARD15Stock market or forex trading graph in futuristic concept suitable for financial investment or Economic trends business idea and all art work design. Abstract finance background - Powered by Shutterstock - Get 15% off with code: PIKWIZARD15

Credit Photo

If you would like to credit the Photo, here are some ways you can do so

Free (free of charge)

Free for personal and commercial use.

Author: People Creations

Similar Free Stock Images

Dynamic Financial Data Display with Stock Market Tickers
Premium
Online trading, Investment, Strategy market plan, and Stock mark
Global Financial Data Analytics with Digital World Map Interface
Digital Financial Data and Dynamic Stock Market Graphs
Abstract Visualization of Financial Data and Digital Analysis
Global Stock Market Digital Data Interface
Premium
Businessman analyzing forex trading graph financial data. Stock Market Investments Funds and Digital Assets. Business finance technology and investment concept. Business finance background.
Dynamic Stock Market Data Display with Graphs and Numbers
Digital Interface with Advanced Data Processing Visualization
Advanced Financial Data and Stock Market Analysis Background
Dynamic Financial Graphs and Data in Digital Abstract
Premium
Stock market graph trading analysis investment financial, stock exchange financial or forex graph stock market graph chart business crisis crash loss and grow up gain and profits win up trend
Dynamic Digital Data and Technology Interfaces
Digital Interface of Social Media Over Data Analytics
Dynamic Visualization of Cyber Security with Malware Concepts
Digital Stock Market Charts with Data Visualizations
Premium
Stock market graph trading analysis investment financial, stock exchange financial or forex graph stock market graph chart business crisis crash loss and grow up gain and profits win up trend
Financial Data Analysis with Smartphone and Digital Interface
Changing Numbers with Stock Market Data in Server Room Environment
Futuristic Financial Trading Graph and Data Visualization
Digital Connectivity Network on Global Graph Background
Premium
Business strategy development and growing growth plan.	
Financial management strategy for business growth.Graph and chart. Investment of growth on currency rate.
Dynamic Stock Market Analysis with Data and Trends Visualization
Financial Data Visualization on Dark Background for Analysis
Abstract Digital Financial Data with Moving Light Trails
Digital Interface with Graphs and Data Overlaid on Building
Premium
graph stock market economics, chart growth business to success globally. concept of investment, plan strategy, increase profit, financial economy, and grow marketing. digital technology trend
Dynamic Financial Data with Global Analytics Concepts
Dynamic Analytics Dashboard with Data Points and Callouts
Digital Data Analytics Dashboard with Interactive Graphs
Financial Data Visualization Overlaying Seaport with Industrial Background
Dynamic Stock Market Ticker Display with Financial Graphs
Dynamic Numeric Data Streaming on Digital Grid Network
Premium
Happy middle aged business man ceo wearing suit standing in office using digital tablet. Smiling mature businessman professional executive manager looking away thinking working on tech device.
Abstract Stock Market Data and Financial Graphs Visualization
Global Finance and Data Visualization Interface Background
Digital Data Processing in Server Room with Interface Overlay
Dynamic Stock Market Data on Digital Display Background
Premium
Businessman works on laptop Showing business analytics dashboard with charts, metrics, and KPI to analyze performance and create insight reports for operations management. Data analysis concept.Ai
Dynamic Financial Data Stream Visualization in Network Grid
Dynamic Interface with Data Streams and Circuit Design
Global Financial Data Analysis on Digital Screen Interface
Digital Data Processing Interface on Screen Grid
Premium
Analyst working with Financial Data and Business Analytics Dashboard on computer to make Financial Report with KPI and Metrics. Investment, Corporate Finance, Strategy, Operations, Sales.
Financial Data Analysis Graph with Growing Trends
Data Analytics and Stock Market Graphs
Dynamic Financial Data Charts Over Grid Background
Digital Financial Data Processing and Analysis
Premium
Investors analyze graph data stock market index via digital tablet screen to trade the stock chart for planning investments take profit, trade stock exchange market and cryptocurrency data, financial.
Futuristic Social Media and Stock Market Interface Design
Financial Data Processing with Digital Graphs and Numbers
Digital Display of Stock Market Data with Neon Elements
Global Financial Market Data on World Map
Premium
Financial stock market numbers and city light reflection
Statistics and Data Processing with Graphs and Charts
Global Data Visualization with Digital World Map and Analytical Graphs
Digital Data Processing with Finance Analytics: Global Business Concept
Abstract Digital Data Charts and Graphs on Screen
Premium
Young indian business man trader wearing glasses looking at computer screen with trading charts reflecting in eyeglasses watching stock trading market financial data growth concept, close up.
Digital Interaction and Data Analytics in Technology
Transparent Screen Displaying Financial Market Trends in Corporate Setting
Digital Screen Showing Financial Analytics Graphs and Data
Digital Stock Market Data Visualization with Rising and Falling Prices
Dynamic Financial Data and Stock Market Interface
Digital Financial Data Stream with Numeric Overlay
Premium
Stock market graph trading analysis investment financial, stock exchange financial or forex graph stock market graph chart business crisis crash loss and grow up gain and profits win up trend.
Financial Data Over Grid Indicating Market Trends and Analytics
Global Financial Markets and Technology Analysis
Dynamic Stock Market Analytics with High-Tech Data Visualization
Abstract Financial Data with Dynamic Stock Quotes
Premium
Stock market chart,Stock market data on LED display concept.
Trending Financial Graphs with Red and Blue Analytics Lines
Financial Data Screens with Global Network Analysis
Digital Interface Screen with Abstract Financial Data Overlay
Digital Data Processing and Financial Chart Analysis
Premium
Stock exchange market graph analysis background
Sustainable Icons Overlay on Financial Data Analysis Concept
Digital Financial Data Graph with Winter Snowflake Theme
Dynamic Stock Market Data Display in Digital Hologram Interface
Dynamic Financial Charts and Data in Futuristic Interface
Premium
Businessman working on digital tablet computer. Business global internet network technology, social media marketing, Financial and banking, Data link, digital technology and global business concept
Digital Stock Market Overview with Graphs and Numbers for Financial Analysis
Holographic Financial Graphs Over Blue Background
Futuristic Data Dashboard with Numbers and Graphs Overlay
Analyzing Financial Data with Digital Graphs on Transparent Screens
Premium
Asia real estate sale agent, stock market trader woman work at bank office talk in tax plan report. Lawyer help ask or advice lease on laptop desk typing fund loan data. Smile happy trust in HR job.
Abstract Financial Data Processing Blue Grid Background
Digital Data Analysis Over World Map Illustrating Global Connections
Digital Interface with Data Graphs and Media Icons
Financial Trading Dashboard with Candlestick and Line Graphs
Premium
Stock market analysis with digital screen , Finance Savings concept, Money saving and deposit for investment
Financial Charts with Blue and Red Lines and Digital Percent Indicators
Neon Financial Dashboard Displaying Market Charts and 38.67% Marker on Tilted Grid Monitor
Floating Numbers in Digital Grid Network
Dynamic Digital Global Finance Interface Visualization
Digital Financial Stock Exchange Data and Green Ascending Graph
Dynamic Financial Data and Graph Arrows in Digital Interface
Premium
Two diverse crypto traders brokers stock exchange market investors discussing trading charts research reports growth using pc computer looking at screen analyzing invest strategy, financial risks.
Global Data Network Processing on Digital Interface
Digital Financial Data, Stock Market Analysis
Global Business Analytics with Digital Data Visualization
Abstract Representation of Stock Market Data Overlaying Urban Landscape
Premium
Stock market or forex trading graph on touchscreen,  finance and investment concept. Economy trends for business, financial charts and digits.
Global Financial Data Analytics with World Map and Graphs
Abstract Digital Financial Data Visualization with Stock Exchange Numbers
Dynamic Financial Data on Digital Interface
Analysis of Financial Data with Graph Trends and Bokeh Lights
Premium
Businessman using laptop computer analyzing sales data and financial growth graph chart report. Business planning, strategy and development. Financial accounting. market research, data analysis
Stock Market Data Visuals Displaying Financial Analysis Trends
Financial Data Visualization with Team Collaboration in Modern Office
Dynamic Financial Statistics Overlay on Cityscape Background
Abstract Financial Data Analysis with Charts and Figures
Premium
Banking business, finance and investment concept. Businessman analyzing market data, financial graph report, economic growth, business strategy, planning and solution, risk management
Digital Financial Data Analysis and Stock Market Charting
Financial Charts Over Cityscape Reflecting Economic Trends
Dynamic Financial Data and Graph Analysis on Digital Display
Financial Data Visualization on Global Virtual Graph
Premium
Businessman using KPI dashboard.Financial business KPI System data analytics graph dashboard.Data System KPI and metrics connected in database for follow earnings,operations and sales data.
Financial Data Overlay with Social Media Metrics
Financial Data Graphic with Rising Trends on Digital Grid
Digital Analytics Dashboard with Social Media Metrics
Dynamic Financial Charts and Stock Market Analytics Display
Premium
Analyst working with Financial Report and Business Analytics Dashboard on laptop computer to analyze Financial Data with KPI and Metrics. Investment, Operations, Sales, Corporate Finance, Strategy.
Futuristic Financial Dashboard Showing Layered Market Charts and Colored Trend Lines