
- Home >
- Stock Photos >
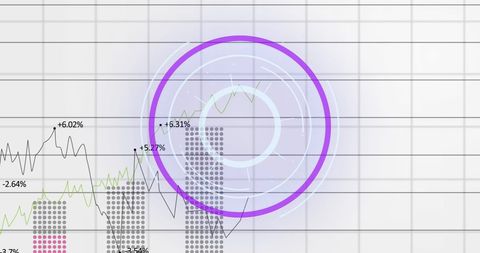
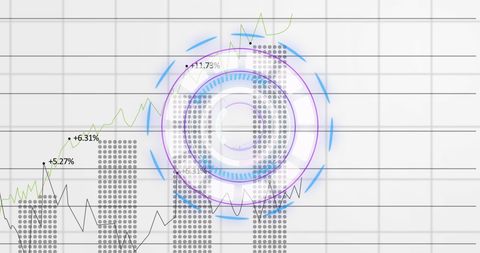
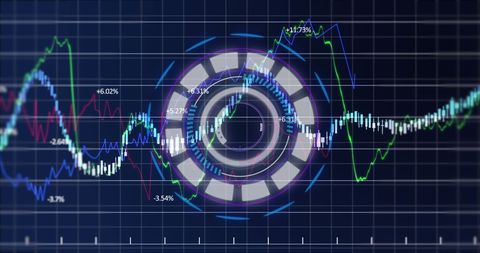
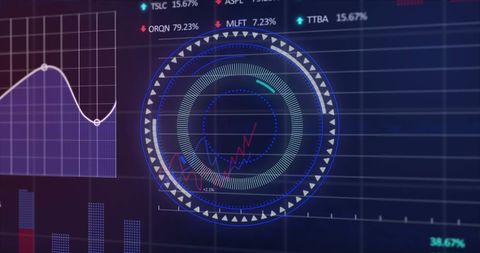
- Digital Finance Scope with Data and Bar Graph Elements
Digital Finance Scope with Data and Bar Graph Elements Image

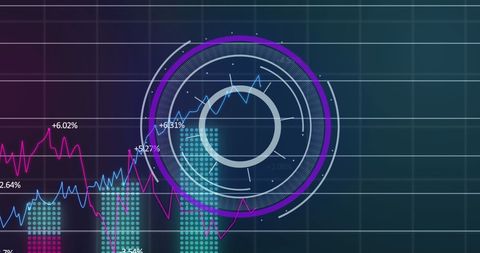
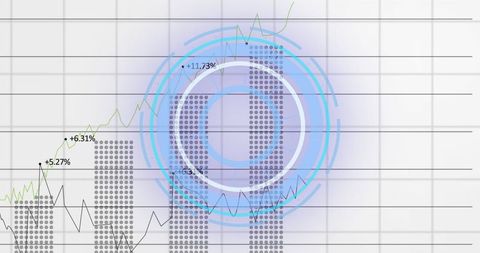
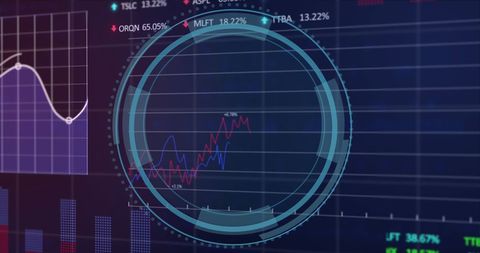
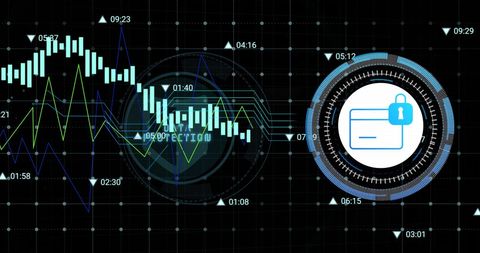
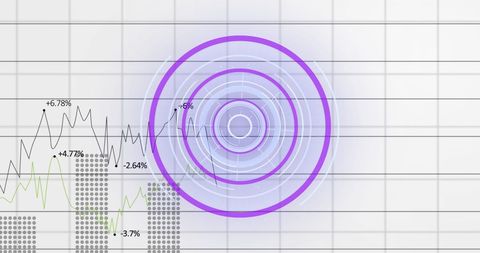
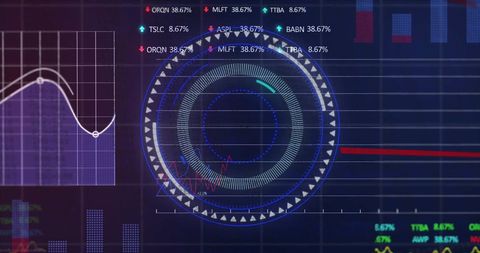
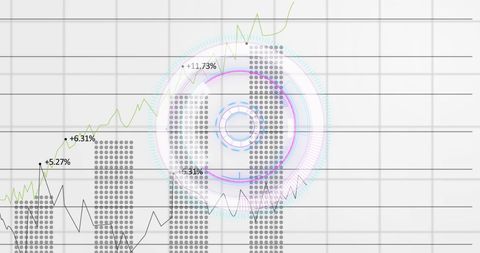
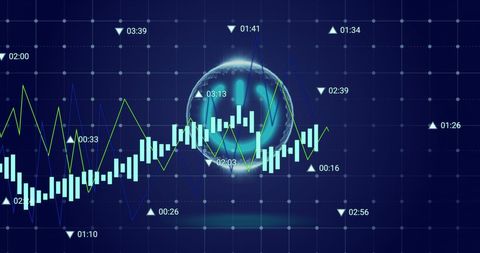
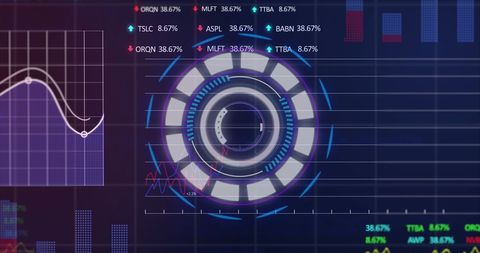
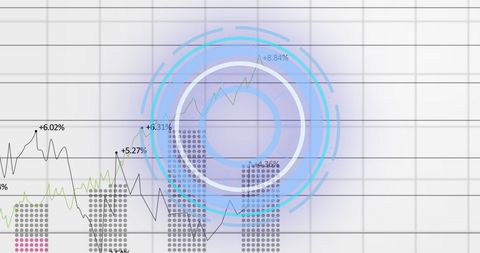
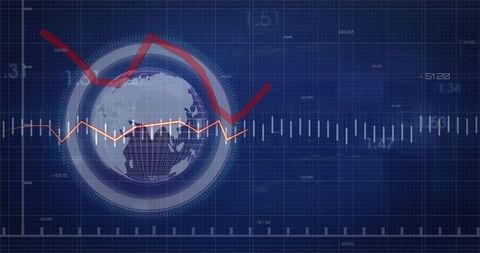
Graphic depicts abstract representations of financial data processing with a focused digital scope in the center and fluctuating graph lines around it, symbolizing financial analysis and technological integration in stock markets. Perfect resource for content related to finance, trading platforms, investment strategies, and technological advancements in data analytics. A valuable asset for blogs, educational materials, or promotional media in the fintech industry.
Powered by 


downloads
Tags:
More
Credit Photo
If you would like to credit the Photo, here are some ways you can do so
Text Link
photo Link
<span class="text-link">
<span>
<a target="_blank" href=https://pikwizard.com/photo/digital-finance-scope-with-data-and-bar-graph-elements/ad0dff6663a4a0edc7a0ee61ccfe0e47/>PikWizard</a>
</span>
</span>
<span class="image-link">
<span
style="margin: 0 0 20px 0; display: inline-block; vertical-align: middle; width: 100%;"
>
<a
target="_blank"
href="https://pikwizard.com/photo/digital-finance-scope-with-data-and-bar-graph-elements/ad0dff6663a4a0edc7a0ee61ccfe0e47/"
style="text-decoration: none; font-size: 10px; margin: 0;"
>
<img src="https://pikwizard.com/pw/medium/ad0dff6663a4a0edc7a0ee61ccfe0e47.jpg" style="margin: 0; width: 100%;" alt="" />
<p style="font-size: 12px; margin: 0;">PikWizard</p>
</a>
</span>
</span>
Free (free of charge)
Free for personal and commercial use.
Author: Authentic Images
Similar Free Stock Images

Premium


Premium

Premium


Premium


Premium


Premium


Premium


Premium


Premium

Premium

Premium


Premium


Premium


Premium


Premium


Premium


Premium


Premium


Premium


Premium


Premium

Premium


Premium


Premium


Premium


Explore More Free Stock Images