
- Home >
- Stock Photos >
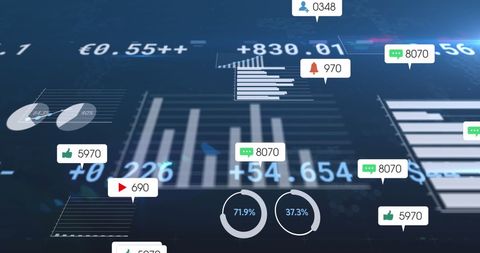
- Digital Finance Stock Exchange Data Visualization
Digital Finance Stock Exchange Data Visualization Image

Abstract backdrop of digital financial data reinforced by dynamic graphs and statistics. Ideal for illustrating content related to stock market analysis, global finance trends, and economic data visualization. Useful for financial websites, business presentations, and analytical platforms focusing on investment opportunities.
Powered by 


downloads
Tags:
More
Credit Photo
If you would like to credit the Photo, here are some ways you can do so
Text Link
photo Link
<span class="text-link">
<span>
<a target="_blank" href=https://pikwizard.com/photo/digital-finance-stock-exchange-data-visualization/7d2d7167577fde9f62b5aa99ac092a99/>PikWizard</a>
</span>
</span>
<span class="image-link">
<span
style="margin: 0 0 20px 0; display: inline-block; vertical-align: middle; width: 100%;"
>
<a
target="_blank"
href="https://pikwizard.com/photo/digital-finance-stock-exchange-data-visualization/7d2d7167577fde9f62b5aa99ac092a99/"
style="text-decoration: none; font-size: 10px; margin: 0;"
>
<img src="https://pikwizard.com/pw/medium/7d2d7167577fde9f62b5aa99ac092a99.jpg" style="margin: 0; width: 100%;" alt="" />
<p style="font-size: 12px; margin: 0;">PikWizard</p>
</a>
</span>
</span>
Free (free of charge)
Free for personal and commercial use.
Author: Creative Art
Similar Free Stock Images

Premium


Premium


Premium


Premium


Premium


Premium


Premium


Premium


Premium


Premium


Premium

Premium


Premium


Premium


Premium


Premium


Premium

Premium


Premium

Premium


Premium


Premium


Premium


Premium


Premium

Explore More Free Stock Images